AI Crypto Forecast: Bittensor, Near Protocol, Internet Computer rebound gains traction
- Bittensor sustains intraday gains, eyeing a $210 breakout amid the support of improving momentum indicators.
- Near Protocol reclaims the $2.00 short-term support despite the MACD indicator sustaining a sell signal.
- Internet Computer’s downtrend cools, reflecting growing investor interest.

Cryptocurrency prices are broadly rising on Thursday, following an overstretched downtrend. Despite sticky geopolitical tensions in the Middle East, tokens at the intersection of the blockchain technology and Artificial Intelligence (AI), including Bittensor (TAO), Near Protocol (NEAR) and Internet Computer (ICP) are testing recovery potential.
Sentiment in the broader crypto market remains largely suppressed, as reflected in the Fear & Greed Index, holding at 12 in the Extreme Fear territory on Thursday, up from 9 the previous day. Given that crypto market behaviour tends to be emotional, investors become fearful when prices fall and greedy in bullish conditions.
Still, extreme fear conditions offer opportunities for fresh entries when prices are low, allowing investors to ride the uptrend.
Bittensor gears up for short-term recovery
Bittensor trades at $209, extending a corrective phase below the key Exponential Moving Averages (EMAs). The 50-day EMA at $251, the 100-day EMA at $257 and the 200-day EMA near $267 all sit overhead, reinforcing a bearish near-term bias while price holds under this compressed cap.
Momentum agrees with this tone, as the Relative Strength Index (RSI) hovers around 37 on the daily chart, shy of oversold but still weak. Moreover, the Moving Average Convergence Divergence (MACD) histogram remains in negative territory, hinting that sellers retain control despite the recent bounce from sub-$200 levels.
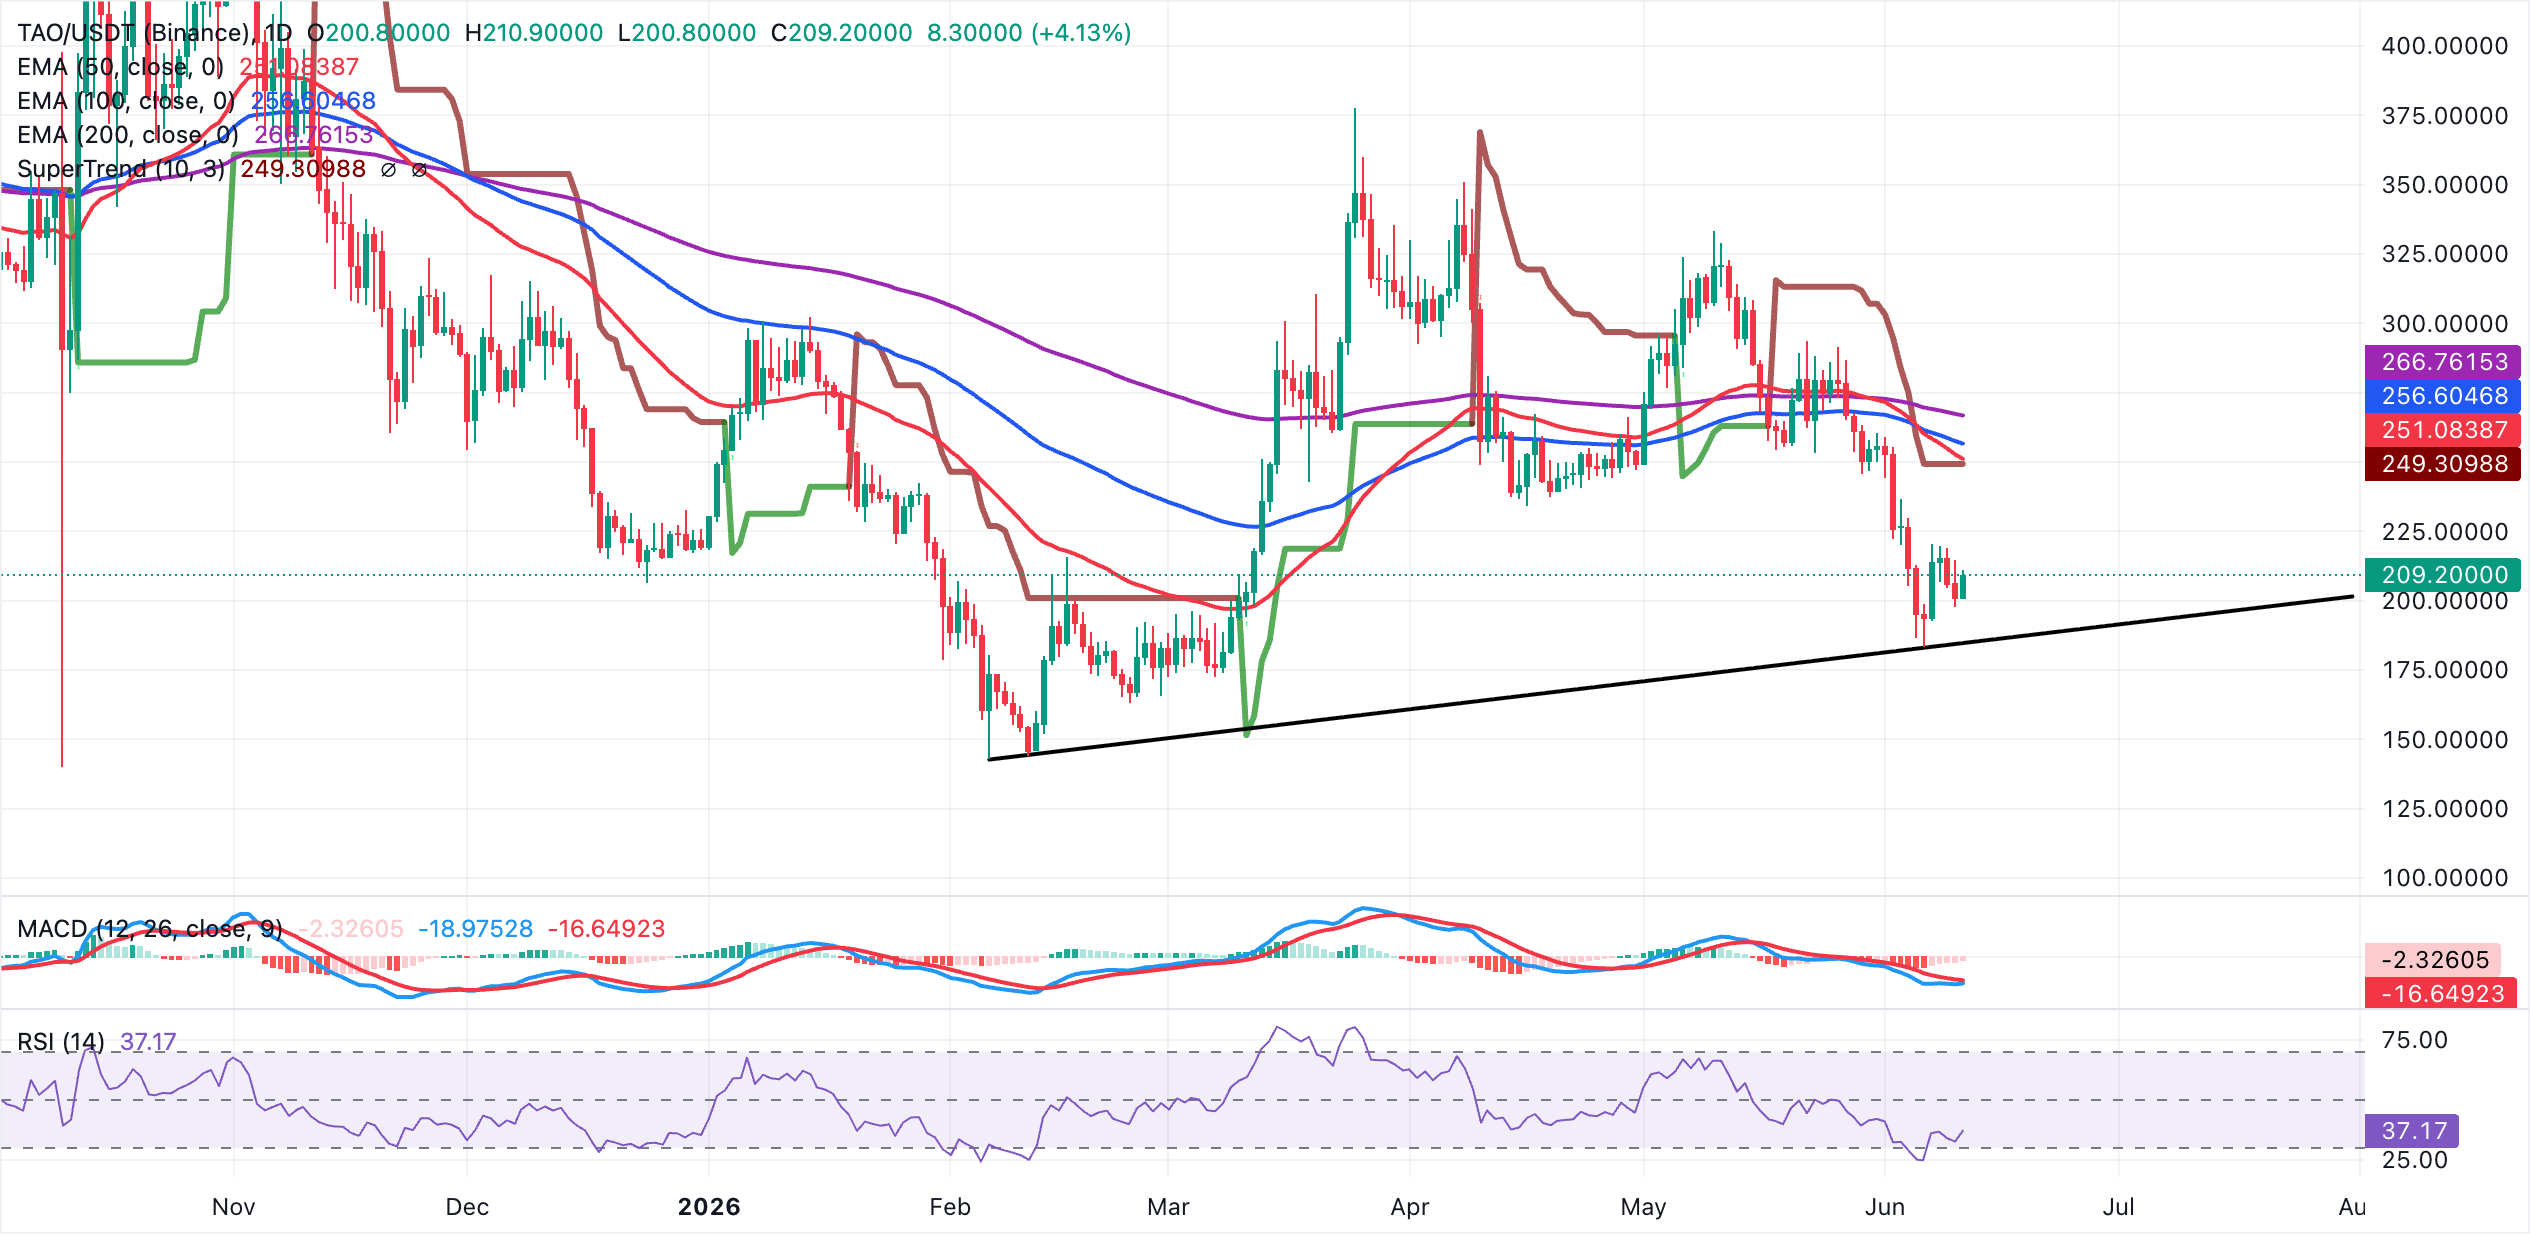
On the downside, a deeper protection is seen near the broken ascending trendline area at roughly $185. Bulls would need to reclaim the 50-day EMA at $251 to ease immediate pressure, with subsequent resistance layered at the 100-day EMA at $257 and then the 200-day EMA around $267, where a sustained break would be needed to challenge the prevailing bearish structure.
Near Protocol holds key support
Near Protocol trades at $2.00, holding above a rising cluster of moving averages but capped well below the prevailing SuperTrend resistance. The 50-day EMA at $1.92 is the nearest dynamic floor, backed by the 200-day EMA at $1.74 and the 100-day EMA at $1.73, which together still hint at an underlying constructive structure despite the recent pullback.
However, the MACD histogram remains below the zero line on the daily chart while the RSI sits near 48, suggesting fading bullish momentum and a consolidative-to-soft tone rather than an impulsive recovery.
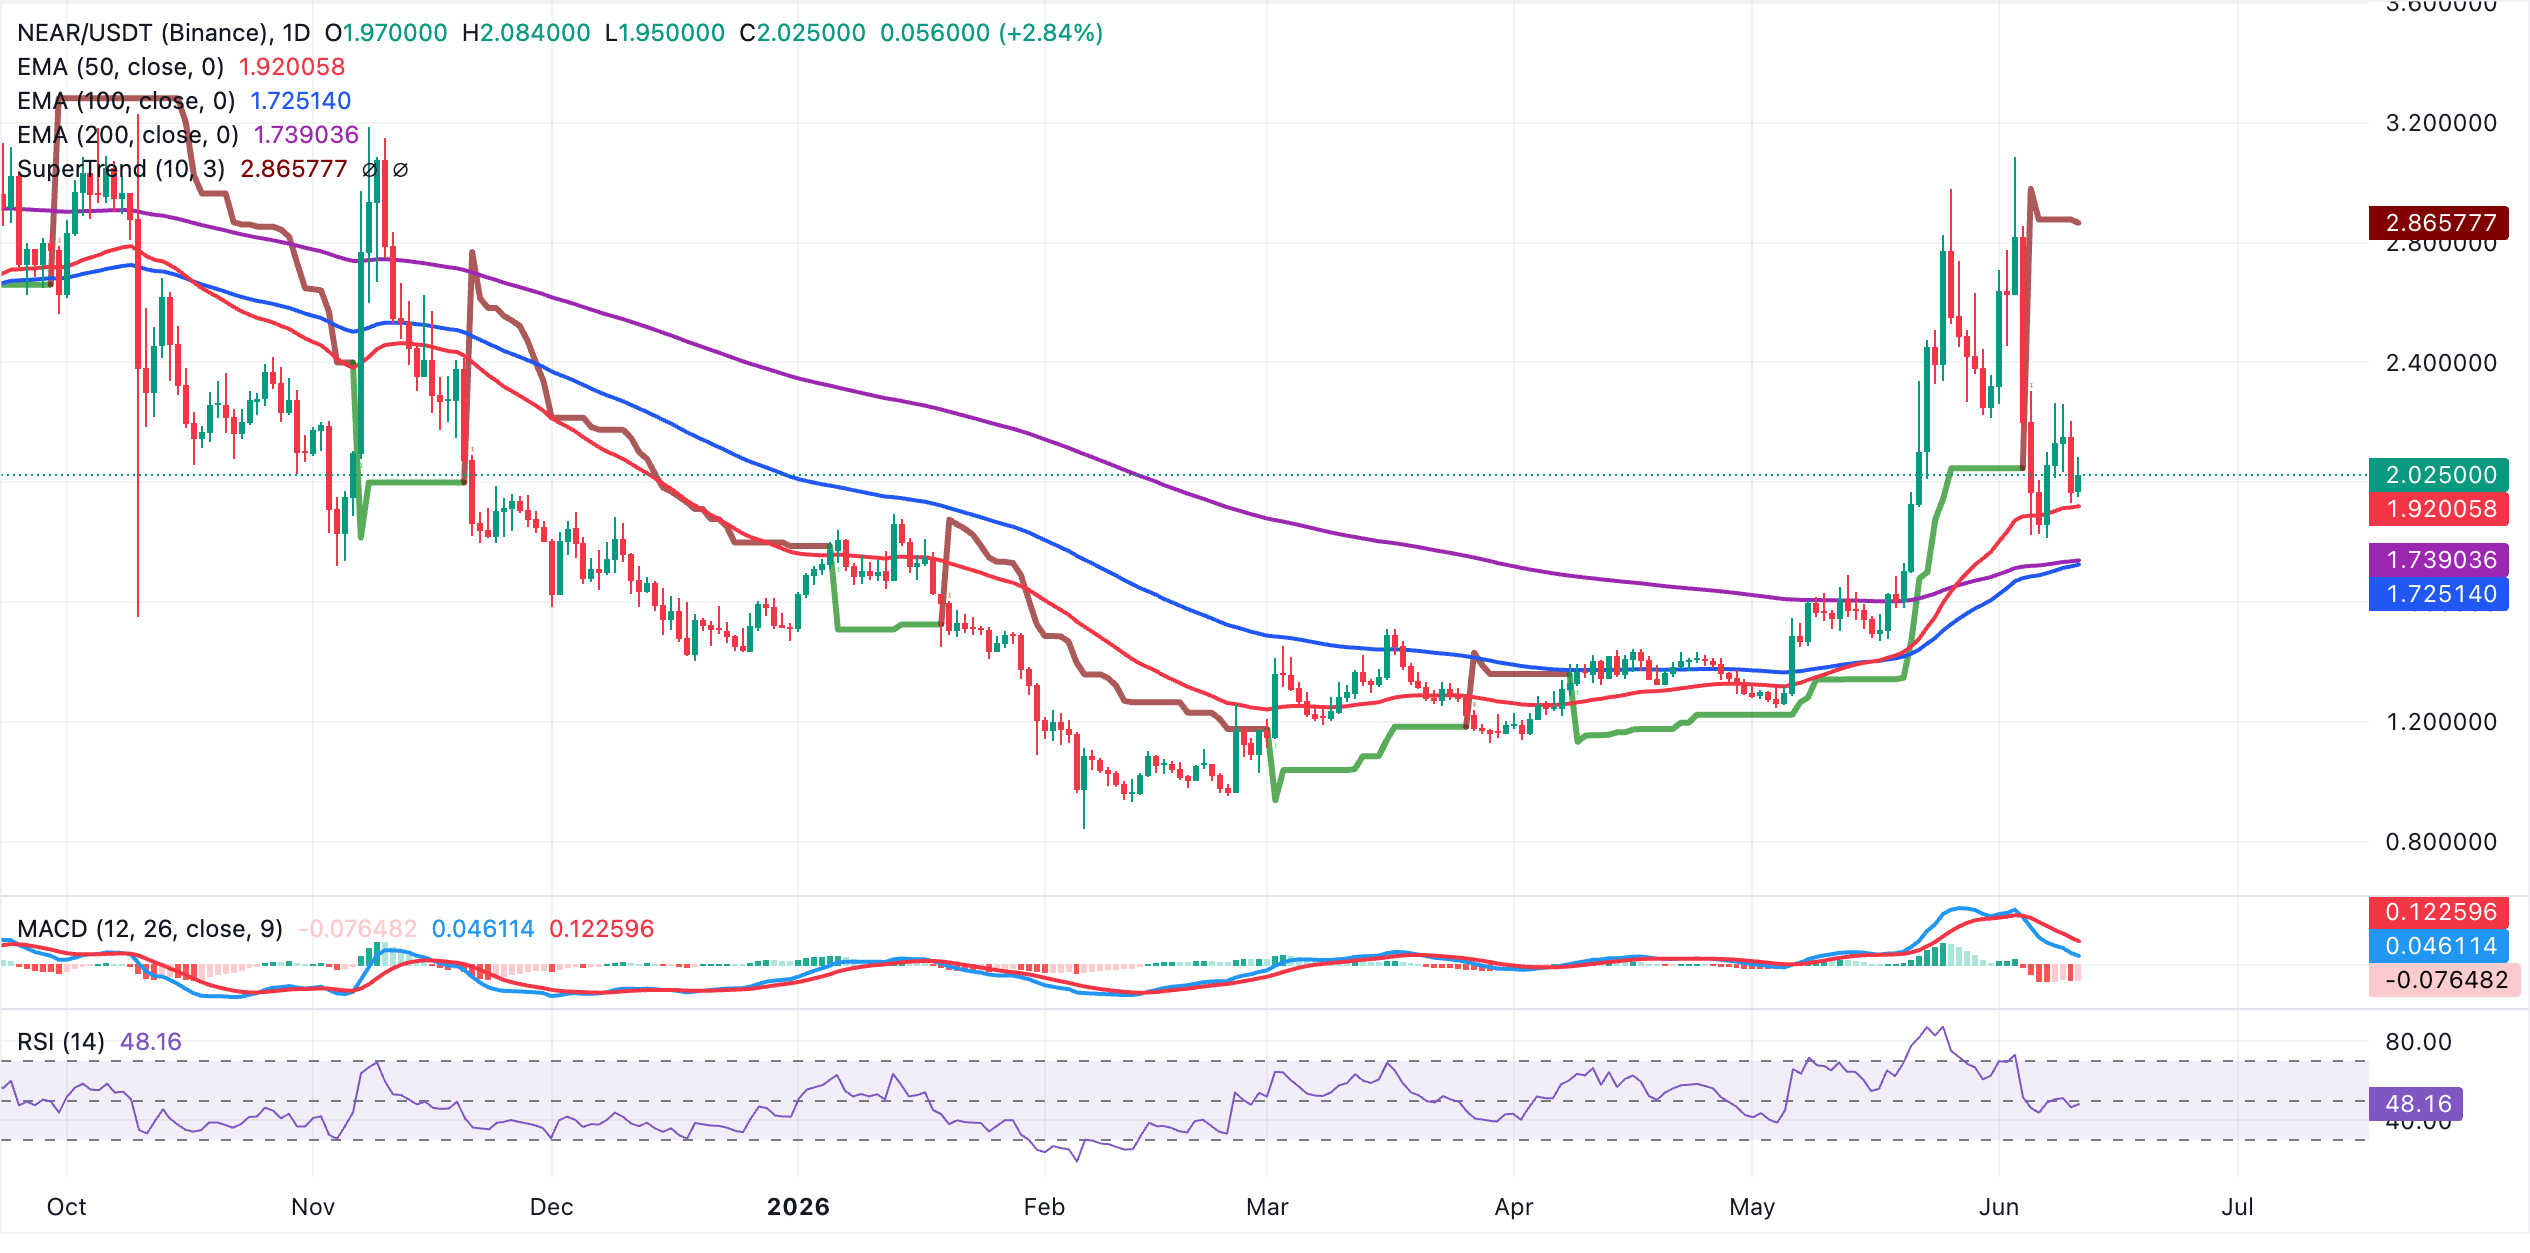
On the topside, the SuperTrend line at $2.87 is the key resistance that bulls would need to reclaim to revive a stronger upside phase. On the downside, initial support lies at the 50-day EMA around $1.92. A daily close below this level would expose the medium-term supports at the 200-day EMA near $1.74 and the 100-day EMA close to $1.73, where buyers are likely to defend the broader uptrend structure.
Internet Computer eyes a steady rebound toward $3.00
Internet Computer trades at $2.27, extending its retreat beneath all the major moving averages and keeping a bearish near-term bias. The 50-day, 100-day and 200-day EMAs at $2.60, $2.66 and $3.00, respectively, all sit overhead and suggest rallies remain corrective within a broader downtrend, while the SuperTrend line near $2.97 reinforces this cap.
Momentum is weak but not extreme, with the RSI hovering around 40, hinting at persistent selling pressure rather than a clean oversold setup.
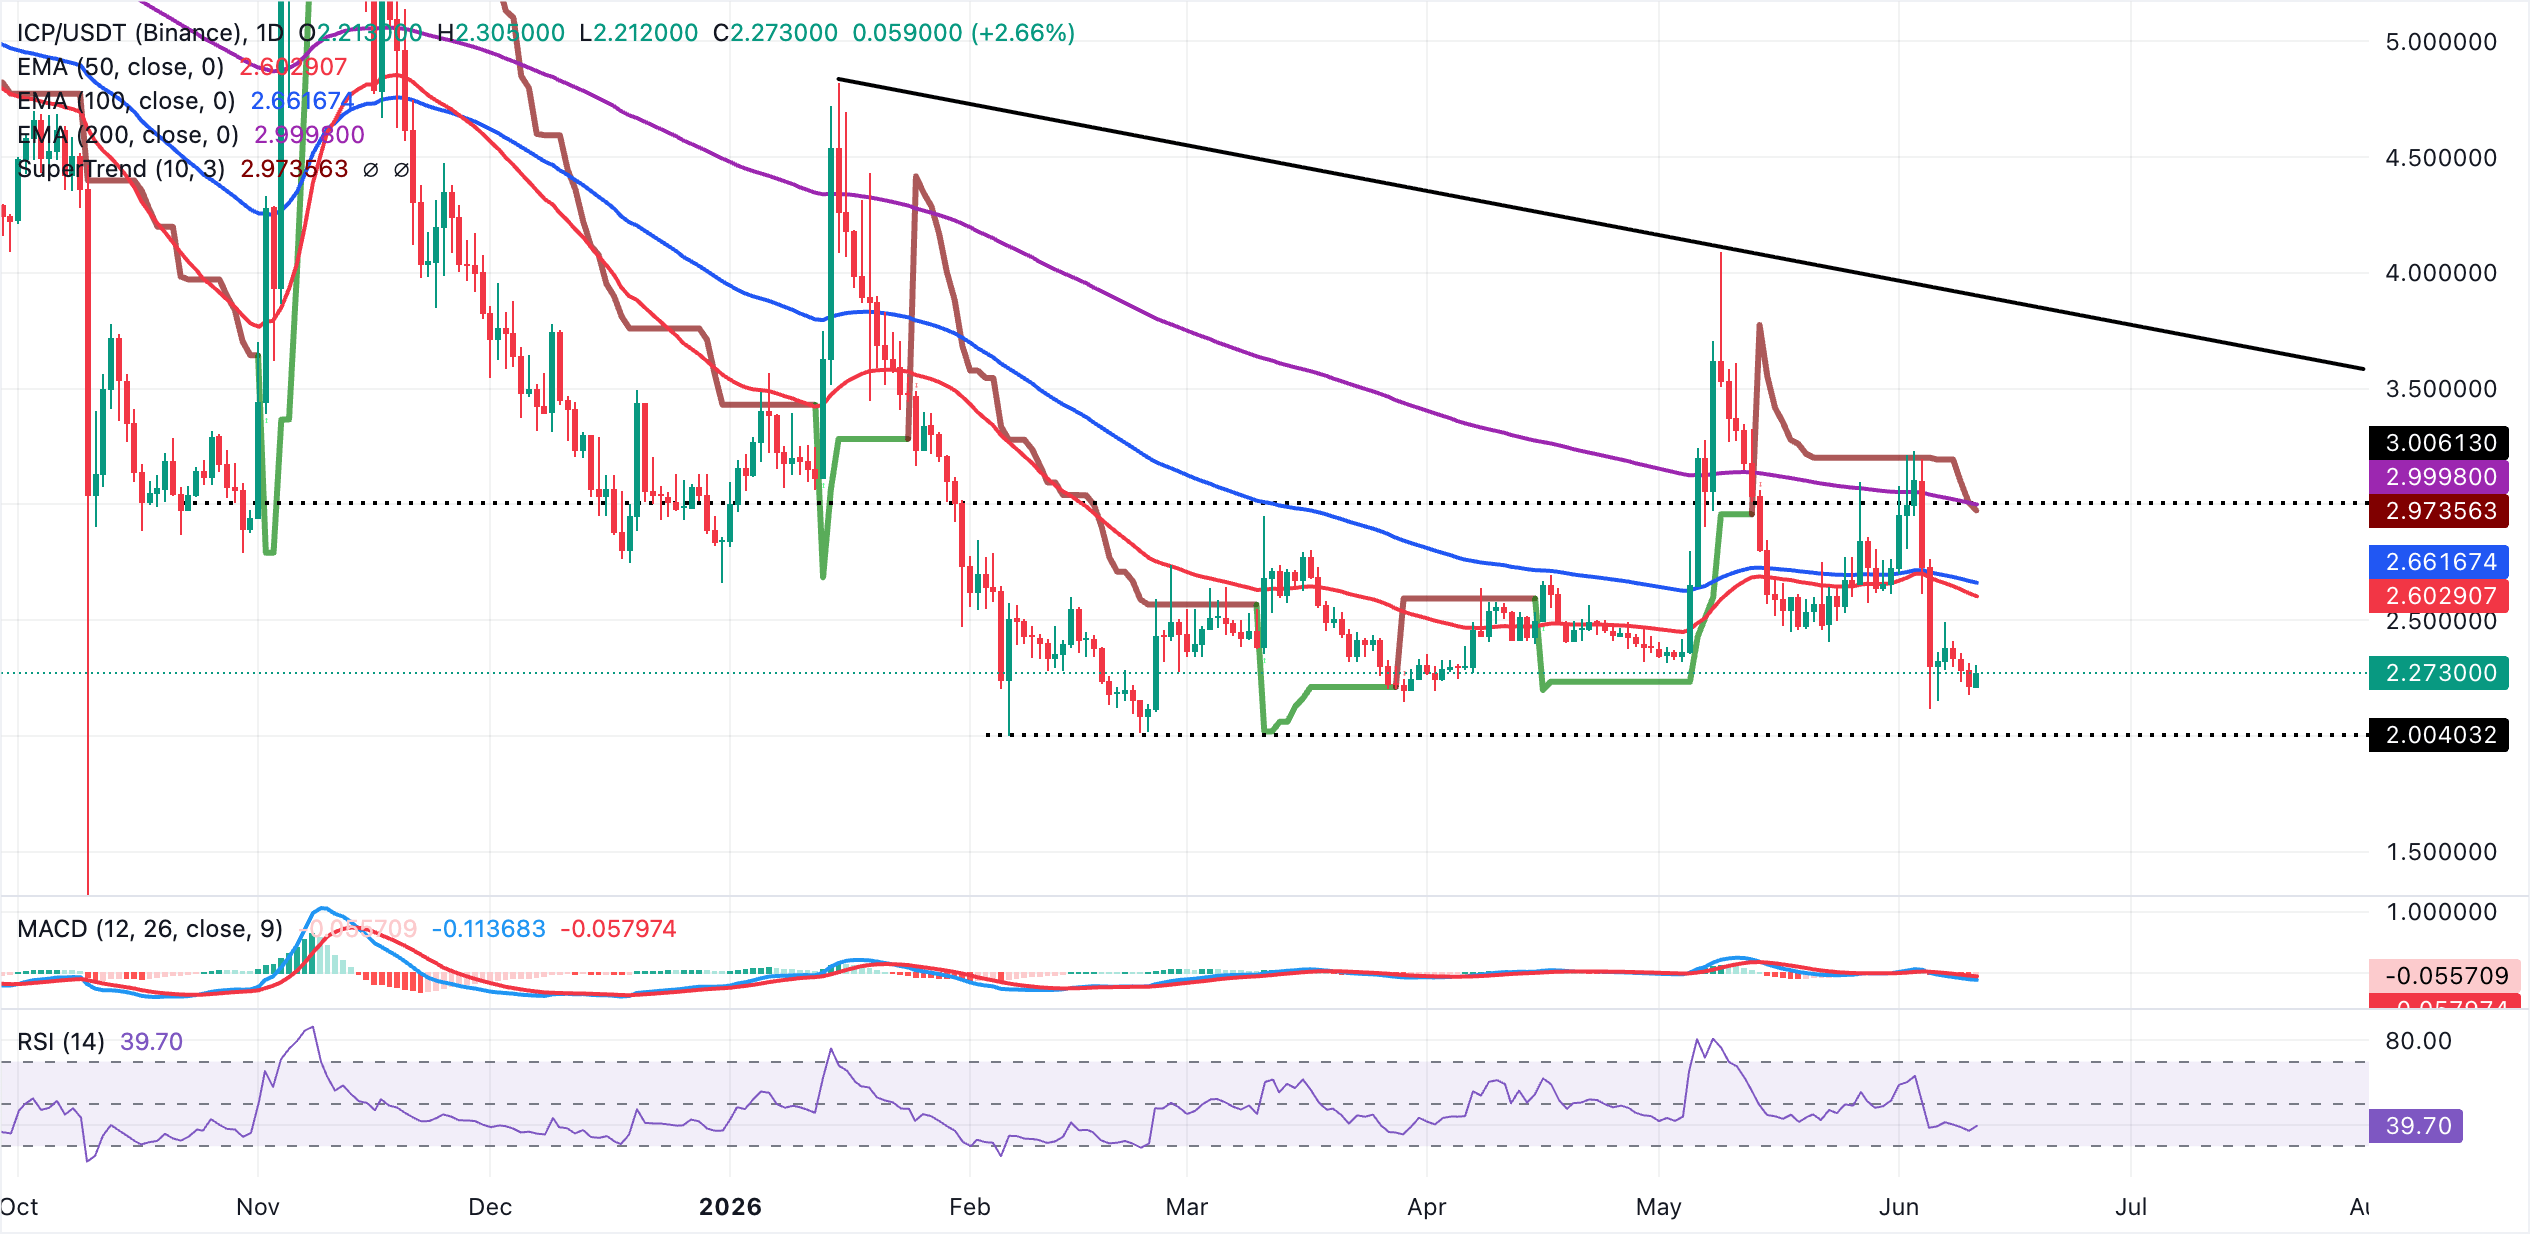
On the topside, initial resistance lies at the 50-period EMA around $2.60, followed by the 100-day EMA near $2.66. Above these zones, the SuperTrend barrier at roughly $2.97 and the 200-day EMA close to $3.00 form a thicker supply band, ahead of the broader downward resistance trendline referenced by the prior break area near $3.90.
With no clear indicator-based supports immediately below the price on the daily chart, any further slide from current levels would leave ICP vulnerable to probing fresh lows until a new demand base emerges on the chart.
(The technical analysis of this story was written with the help of an AI tool.)
Bitcoin, altcoins, stablecoins FAQs
Bitcoin is the largest cryptocurrency by market capitalization, a virtual currency designed to serve as money. This form of payment cannot be controlled by any one person, group, or entity, which eliminates the need for third-party participation during financial transactions.
Altcoins are any cryptocurrency apart from Bitcoin, but some also regard Ethereum as a non-altcoin because it is from these two cryptocurrencies that forking happens. If this is true, then Litecoin is the first altcoin, forked from the Bitcoin protocol and, therefore, an “improved” version of it.
Stablecoins are cryptocurrencies designed to have a stable price, with their value backed by a reserve of the asset it represents. To achieve this, the value of any one stablecoin is pegged to a commodity or financial instrument, such as the US Dollar (USD), with its supply regulated by an algorithm or demand. The main goal of stablecoins is to provide an on/off-ramp for investors willing to trade and invest in cryptocurrencies. Stablecoins also allow investors to store value since cryptocurrencies, in general, are subject to volatility.
Bitcoin dominance is the ratio of Bitcoin's market capitalization to the total market capitalization of all cryptocurrencies combined. It provides a clear picture of Bitcoin’s interest among investors. A high BTC dominance typically happens before and during a bull run, in which investors resort to investing in relatively stable and high market capitalization cryptocurrency like Bitcoin. A drop in BTC dominance usually means that investors are moving their capital and/or profits to altcoins in a quest for higher returns, which usually triggers an explosion of altcoin rallies.
Author

John Isige
FXStreet
John Isige is a seasoned cryptocurrency journalist and markets analyst committed to delivering high-quality, actionable insights tailored to traders, investors, and crypto enthusiasts. He enjoys deep dives into emerging Web3 tren


