Stock market in turmoil: Nasdaq, S&P 500, Dow, and Russell 2000 hit major support levels

Tesla, NVIDIA, and Apple under pressure as volatility rises
Stock market recap: Volatility dominates Wall Street for the third consecutive week
The US stock market has suffered another brutal week, marking three consecutive weeks of declines across all major indices. The Russell 2000 March Futures (RTYH25) led the losses, plunging more than 16% from its December 2024 highs, while the Nasdaq 100, S&P 500, and Dow Jones also broke through key technical levels. Volatility surged in the latter half of the week, adding uncertainty to the market outlook.
Investors are now questioning whether the worst of the sell-off is over or if further declines are ahead. As we head into the second week of March, key support and resistance levels will determine the next market direction.
Nasdaq 100 March futures (ENQH25): Battling to recover after breaking key support
After tumbling below the critical 20,600 support level earlier in the week, Nasdaq 100 Futures found a temporary bottom at 19,850, leading to a modest rebound. As of the close on Friday, March 7, 2025, the Index targets the 20,228 resistance level, aligning with key support from September 2024.
Despite this bounce, market sentiment remains fragile. A sustained move above 20,228 and 20,357 could pave the way to a recovery toward 20,600, 20,728, and 21,096. However, failure to hold above 19,850 may trigger another wave of selling pressure, with downside targets at 18,974 and 18,232.
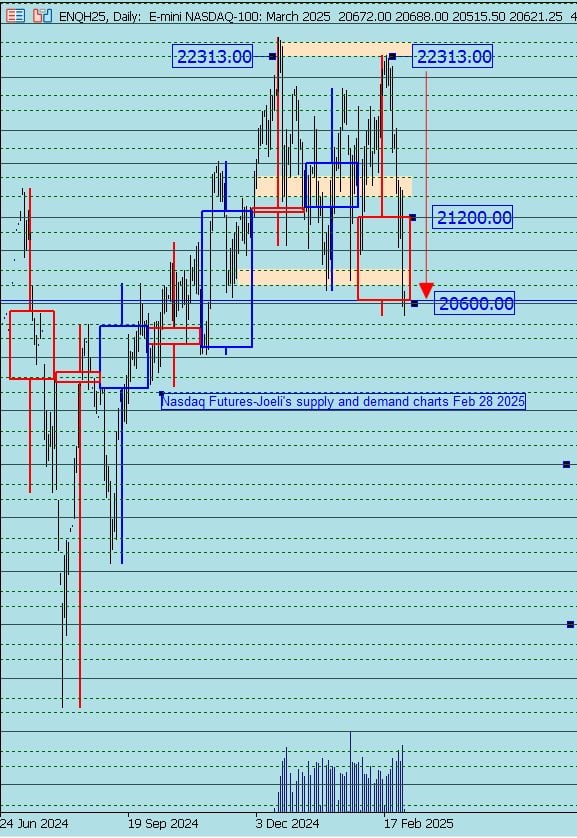
Nasdaq 100 March Futures(ENQH25) Feb 28 2025 price chart analysis
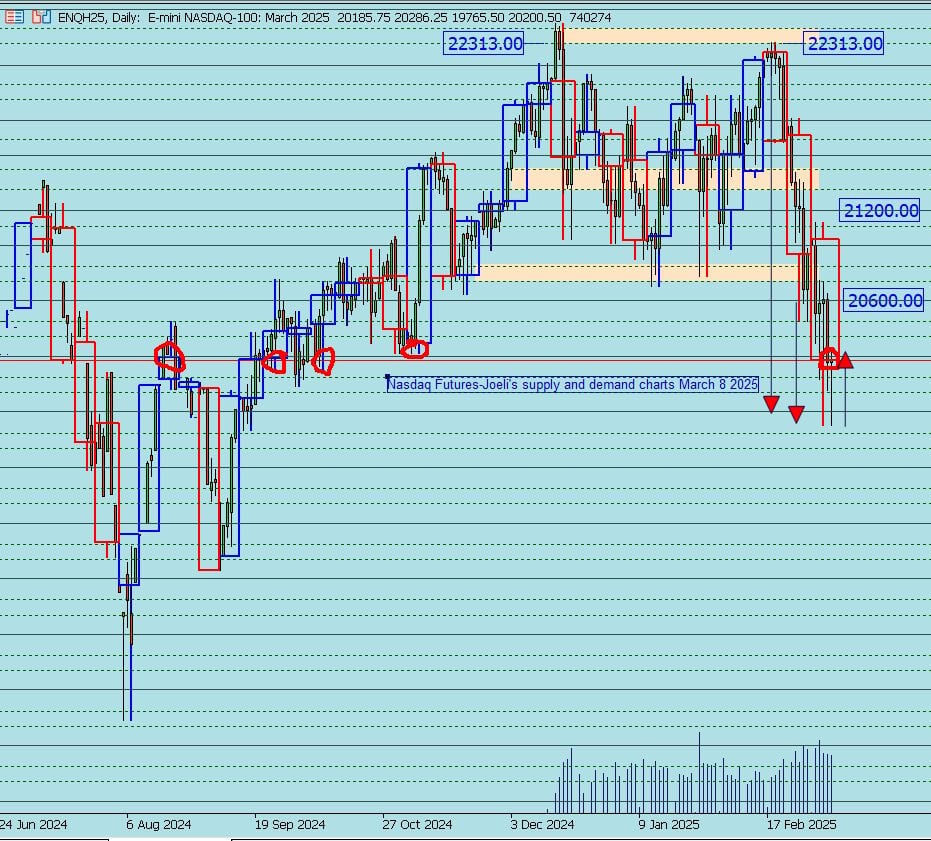
Nasdaq 100 March Futures(ENQH25) March 7 2025 price chart analysis
Tesla (TSLA), NVIDIA (NVDA), and Apple (AAPL): Key stocks under pressure
Tesla (TSLA): Struggling to find support amid deep declines
Tesla's stock has plunged over 46% since December 2024, breaking below the 481 resistance zone and testing key long-term support at 263 and 244. If buyers defend this level, short-term recovery targets lie at 275.70, 294.90, and 306.74. However, a break below 244 could see Tesla tumble further to 232, 220, and 213.
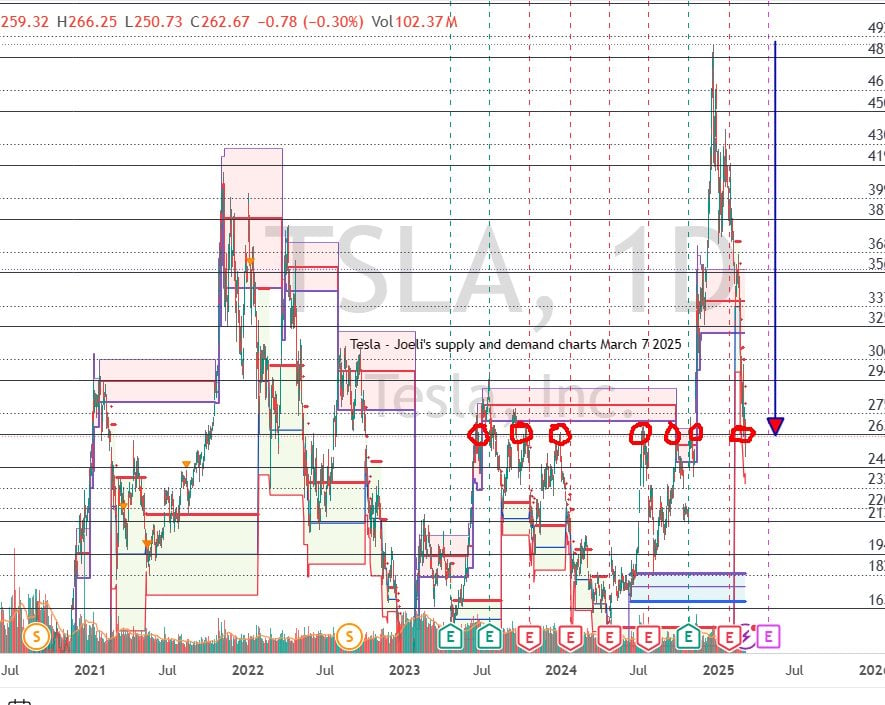
Tesla (TSLA) price chart analysis, March 7 2025
NVIDIA (NVDA): A sharp decline despite strong earnings
NVIDIA has been caught in a 21% decline over the past three weeks and is now 26% off its January 2025 high of 153. The company's latest earnings report exceeded expectations at $39.33B vs. $38.1B, but failed to stop the stock's decline.
The recent breach of 139.28 support has accelerated losses, with the stock now trading at 112.70. Key support levels to watch next week are 107.34, 102.40, and the critical 100.00 mark. A break below 100 could shift the bearish long-term trend, targeting 94.00, 91.00, 86.00, and 83.00.
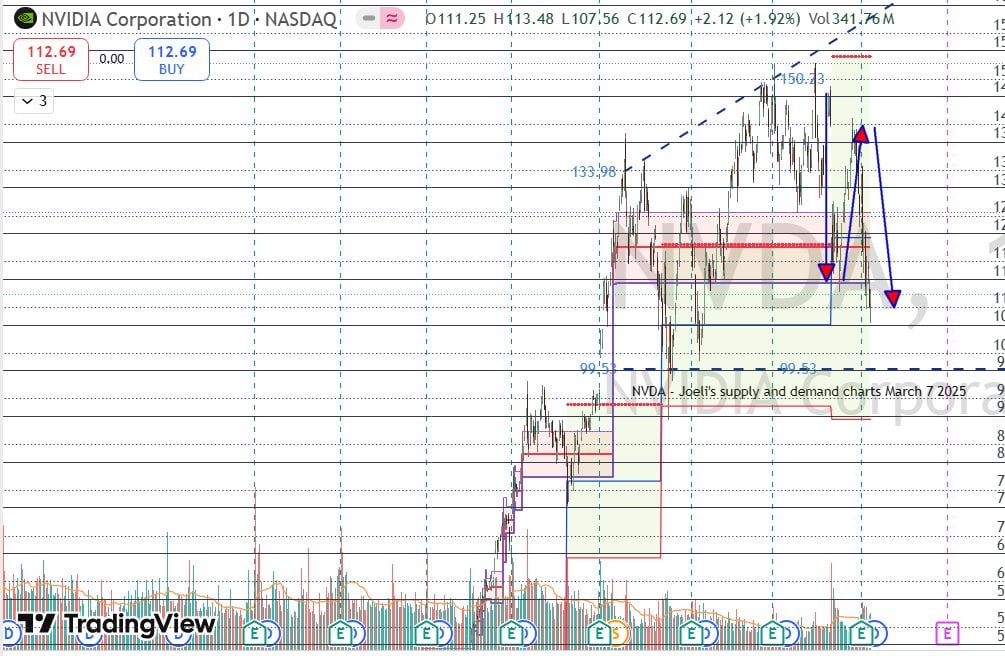
NVIDIA (NVDA) price chart analysis, March 7 2025
Apple (AAPL): Defying the market with resilient support
Apple's stock has fared slightly better and had minimal impact in the latest sell-off. It is down close to 4% and 8% from its December 2024 peak of 260.00. The 237.32 support level remains intact but is being closely tested. Apple closed at 238.70 on Friday, March 7, 2025, and will need to hold above 237.32 to attempt a recovery toward 238.80, 241.30, and 242.82.
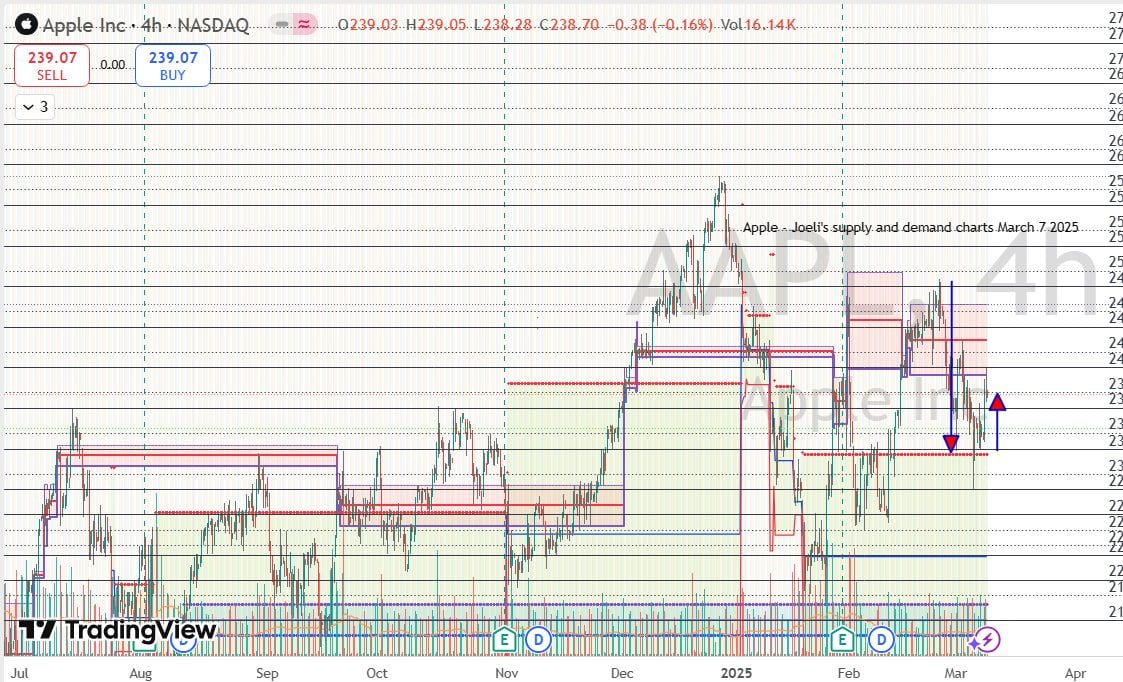
Apple (AAPL) price chart analysis, March 7 2025
S&P 500 March futures (EPH25): Key support levels in focus
S&P 500 Futures suffered another major setback after failing to break the 5,960 resistance zone earlier this week. The Index is now down more than 6% from its 6,171 high and posted a 3% loss this week alone.
Two critical support levels—5,960 and 5,848—were breached during the sell-off, with 5,682 acting as the latest key level. If buyers hold this support, we could see a move toward 5,733 and 5,765, aligning with the September 2024 support zone. However, failure to hold could see further downside to the 5,627, 5,600, and 5545 support zones.
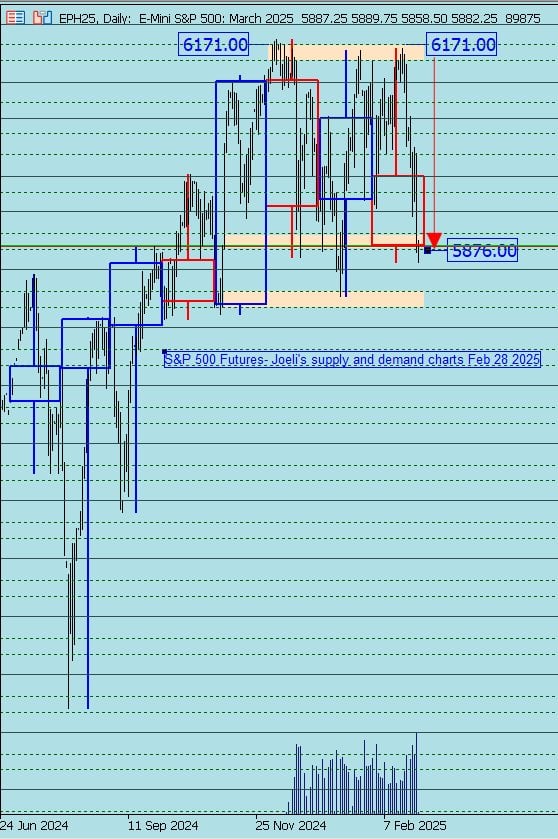
S&P 500 March futures (EPH25) Feb 28 2025 price chart analysis
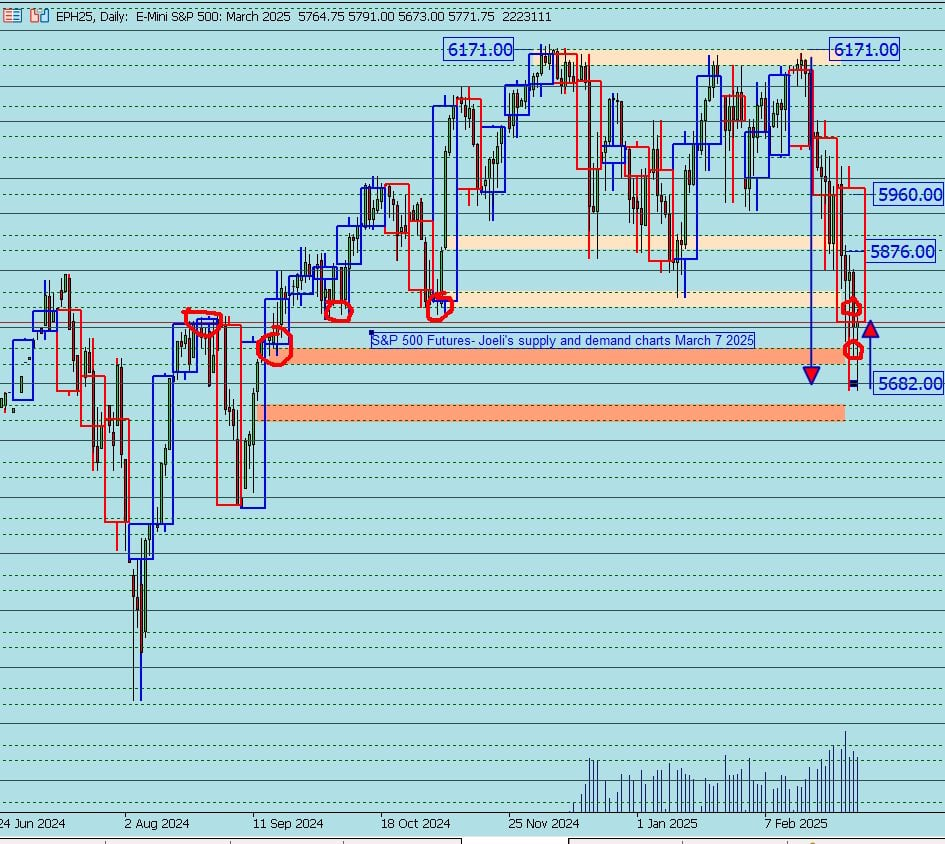
S&P 500 March futures (EPH25) March 7 2025 price chart analysis
Dow Jones March futures (YMH25): Navigating heavy selling pressure
Dow Jones Futures followed the broader market downtrend, with losses exceeding 4% this week and over 6% from December 2024 highs. The Index was rejected at the 43,910 resistance zone, leading to a drop below 43,221 before bouncing slightly to 42,809 at the close of Friday, March 7, 2025.
The 42,254 support zone has proven crucial, aligning with historical support from September and November 2024. Next week, traders should watch 42,725 and 42,532 as potential supports. If 42,532 fails, further declines could target 42,354. Conversely, a break above 42,958 could pave the way for a retest of 43,221 and 43,647.
A technical symmetric triangle pattern has been forming in combined daily and weekly charts, with multiple false breakouts on both sides. The recent downside breach suggests selling pressure remains dominant, but a move above 43,647 could shift the momentum back to buyers targeting the 43910 resistance zone, 44336, and 44786 zone.
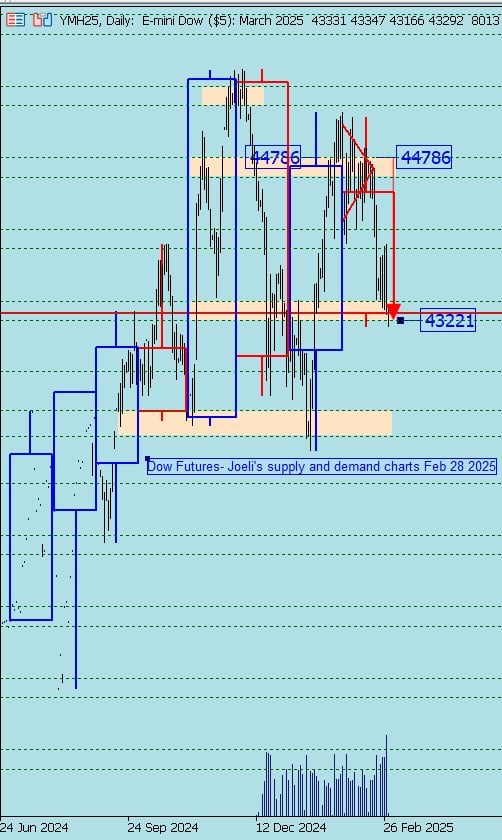
Dow Futures March Futures (YMH25) Feb 28 2025 price chart analysis
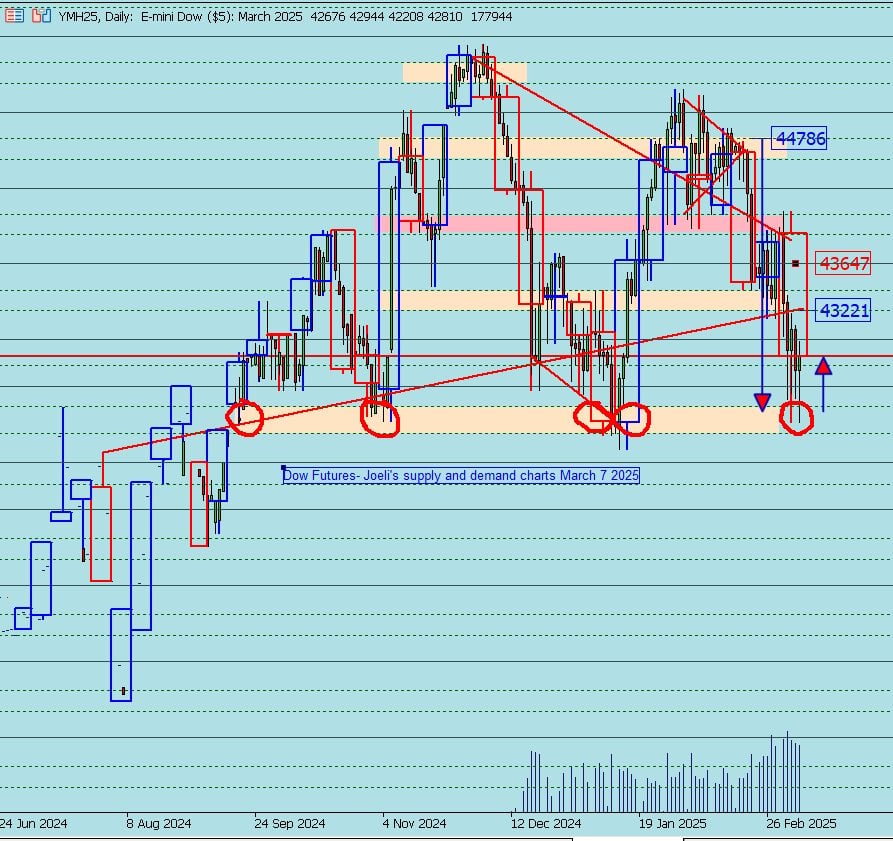
Dow Futures March Futures (YMH25) March 7 2025 price chart analysis
Russell 2000 March futures (RTYH25): The worst performer among major indices
The Russell 2000 Futures suffered the steepest decline among US indices, falling over 16% from its 2,502 high in December 2024 and over 10% since breaking below the 2,331 resistance zone.
A major head and shoulders reversal pattern has played out, with prices now testing the 2,034 key support level. Additionally, the Relative Strength Index (RSI) has reached oversold conditions, suggesting a potential recovery if buyers can defend 2,080.
Key upside targets include 2,107 and 2,176, but if the 2,034 support fails, a deeper pullback to 1,965 could take shape, potentially pushing the small-cap Index into a technical bear market.
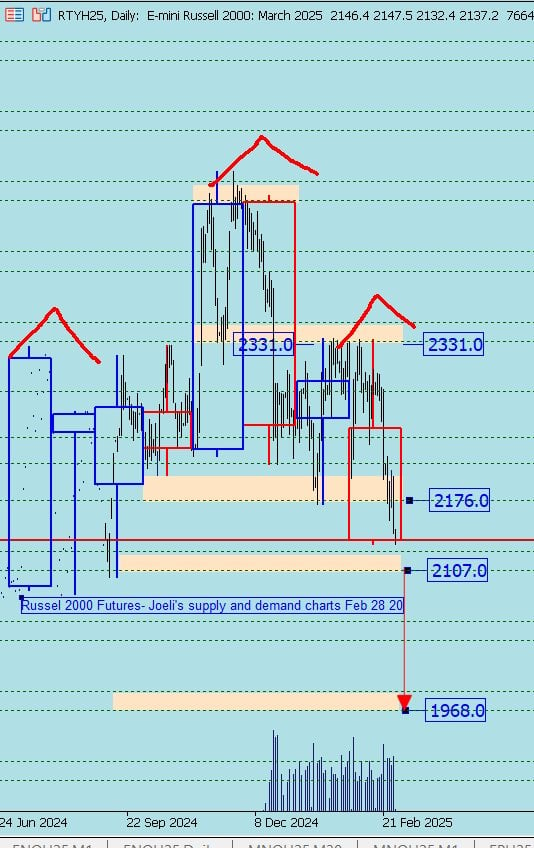
Russell 200 March futures (RTYH25) Feb 28 2025 price chart analysis
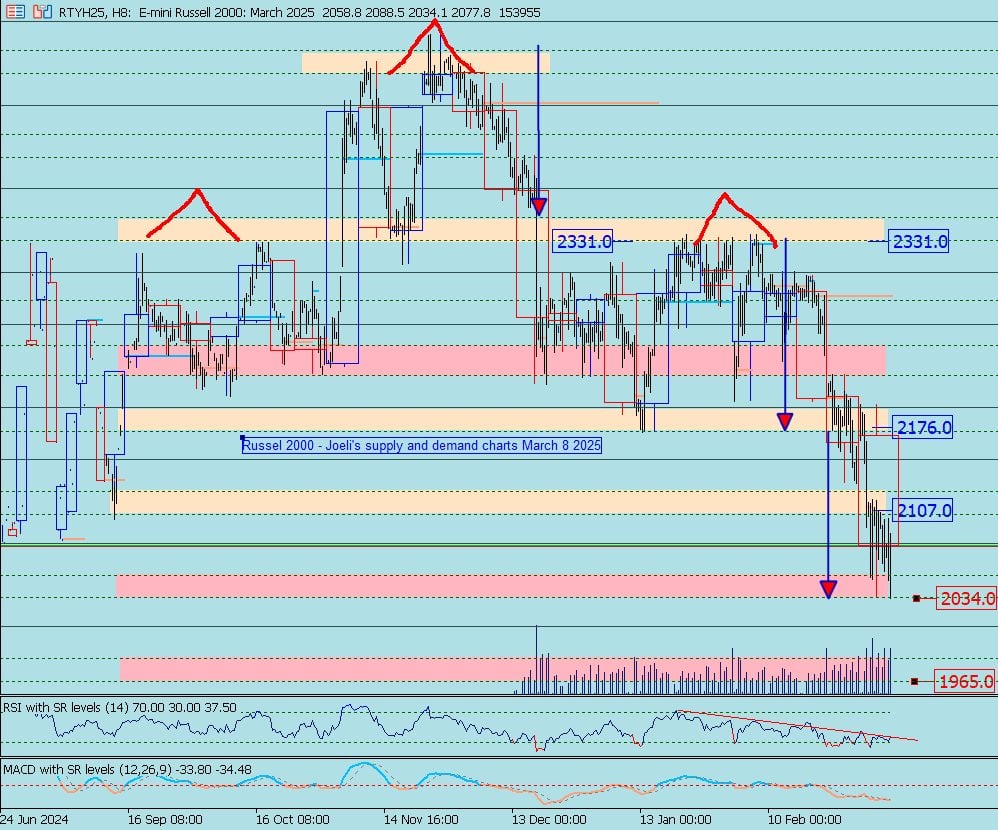
Russell 200 March futures (RTYH25) March 7 2025 price chart analysis
Conclusion: Key levels to watch next week
The ongoing sell-off continues to pressure all major US indices, with the Russell 2000 leading losses while the Nasdaq 100, S&P 500, and Dow Jones test crucial support levels.
- Nasdaq 100: Holding support at 19,850 is key for a potential recovery toward 20,600. A break below could target 19,487 and 18974.
- S&P 500: 5,682 support needs to hold, or the index risks falling to 5,600 and 5545.
- Dow Jones: 42,532 is critical to avoid further downside toward 42,354 and 41843.
- Russell 2000: The 2,034 zone must hold, or the index risks entering a bear market below 1,965.
The coming week will be crucial for determining whether the market can stage a relief rally or if the downtrend accelerates further. Traders and investors should closely monitor these technical levels for key breakout or breakdown signals.
Author

Denis Joeli Fatiaki
Independent Analyst
Denis Joeli Fatiaki possesses over a decade of extensive experience as a multi-asset trader and Market Strategist.

















