Stock market could see massive rally this week
- President Trump moves closer to a possible deal with Iran.
- Oil prices shot down 7% on Monday as the market expects a peace deal.
- Bank of America indicator shows heavy buying pressure from bulls.
- Goldman Sachs sees extensive hedge buying of tech stocks.

Despite launching a blistering rally in the two months after the S&P 500 bottomed out on March 30, the US stock market could be revving up for another explosion higher this Memorial Day-shortened week.
The vaunted peace deal to end the United States' (US) three-month-old conflict with Iran is showing signs of inching toward the finish line on Monday. Meanwhile, hedge funds piled into technology stocks last week at the fastest rate in almost three months, according to Goldman Sachs. And Bank of America says its proprietary Bull & Bear Indicator climbed to 8.0 last week, demonstrating robust greed among investors.
Here's a look at some of the events that could prolong the current rally and some that might undermine it.
Market expects major deescalation in US-Iran war
US Oil (WTI) traded below $90 on Monday for the first time since mid-April as a flurry of headlines over the weekend contributed to a belief that the US and Iran might ink a 60-day ceasefire deal that would implement an end to the war, reopen the Strait of Hormuz, and place negotiations over Iran's enriched uranium on a separate track.
While US President Donald Trump sought to change some of the deal's contours on Monday, Trump himself said that only about 5% of the details were left to be negotiated. Iranian diplomats also appeared optimistic about a possible breakthrough and didn't deny that an opening of the Strait could soon emerge.
Lower Oil prices would certainly brighten the outlook of US equities at a time when the world is facing a shortfall of more than 600 million barrels due to Iran's partial closure of the Strait back in March.
Of course, Israel remains a counterweight to the negotiations and continued pounding Lebanon with bombs on Monday, but Iran is holding to its earlier requirement that Israel end hostilities. On Monday, President Trump tried and failed to get a number of Arab states to recognize Israel under the Abraham Accords framework, but diplomatic observers seem to be more hopeful about this round of negotiations, which continue to take place via Pakistani mediators.
Investors are greedy to own stocks
Bank of America Strategist Michael Hartnett is out with a report talking about the dangers of extremely high bullish sentiment. Hartnett says that the US stock market's concentration in AI stocks and semiconductors is trending toward higher levels than both the DotCom and Nifty Fifty eras. This type of speculative excess tends to be followed by punishing down cycles, according to Hartnett's research.
However, it's important to note that Hartnett sees the pending IPOs of SpaceX, OpenAI and Anthropic as the metaphorical straws that break the camel's back. This could be true, and a growing host of market analysts are saying the same thing. However, based on our short-term outlook, the SpaceX IPO is scheduled until mid-June and so shouldn't be included in any immediate consideration.
As it stands, capital is still pouring into the market. US equity funds just logged their eighth straight week of inflows, and investors piled $9 billion into tech funds alone — the biggest weekly surge the sector has seen since October 2025.
Goldman's own report says that hedge fund portfolios now hold their largest technology positions relative to the MSCI world index in over five years. In the long run, this might be a reason to take profits off the table. But in the short run, it shows how heavy the bets are on the rally resuming.
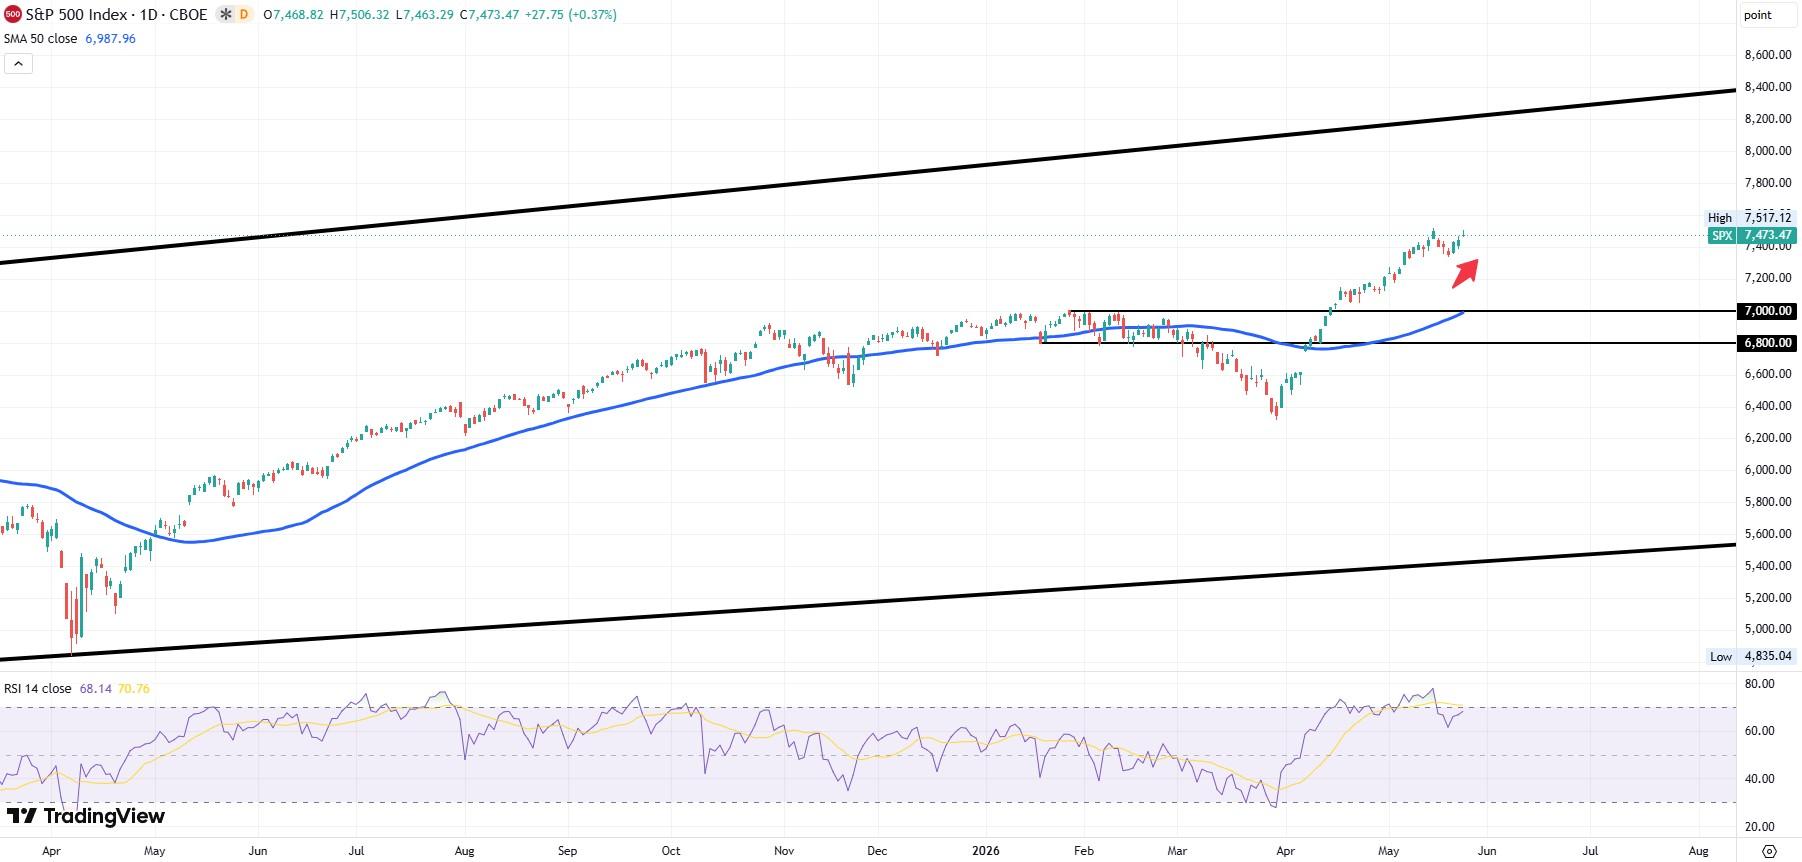
S&P 500 daily index chart
The long-term trend channel for the S&P 500, which has worked since the pandemic era, tells us that the index still has room to run before reaching the top trendline. That doesn't come until 8,200-8,300, which coincides with many Wall Street banks' year-end projections. The mini-pullback following the May 14 all-time high at 7,517 has also pushed the previously overbought Relative Strength Index (RSI) down to 68. This means that in the near term, the bears are unlikely to get the upper hand simply based on excessive momentum.
If a pullback does ensue, expect the S&P 500 to find its footing near the 50-day Simple Moving Average (SMA) that will soon bisect the former 7,000 resistance level.
Author

Clay Webster
FXStreet
Clay Webster grew up in the US outside Buffalo, New York and Lancaster, Pennsylvania. He began investing after college following the 2008 financial crisis.

















