SPX Elliott Wave: Rally from the blue box buying zone

Our Elliott Wave analysis has identified several high-quality trading setups recently, including the SPX setup discussed below. The analysis identified a clear three-wave correction from the recent peak, with price eventually reaching the Equal Legs area highlighted as our Blue Box buying zone.
This is the type of setup we closely monitor within our trading service. The Blue Box defines a specific area where we look for a potential long entry, while the Elliott Wave structure helps us manage risk and identify potential targets.In the following sections, we will break down the SPX setup and show how the opportunity developed.
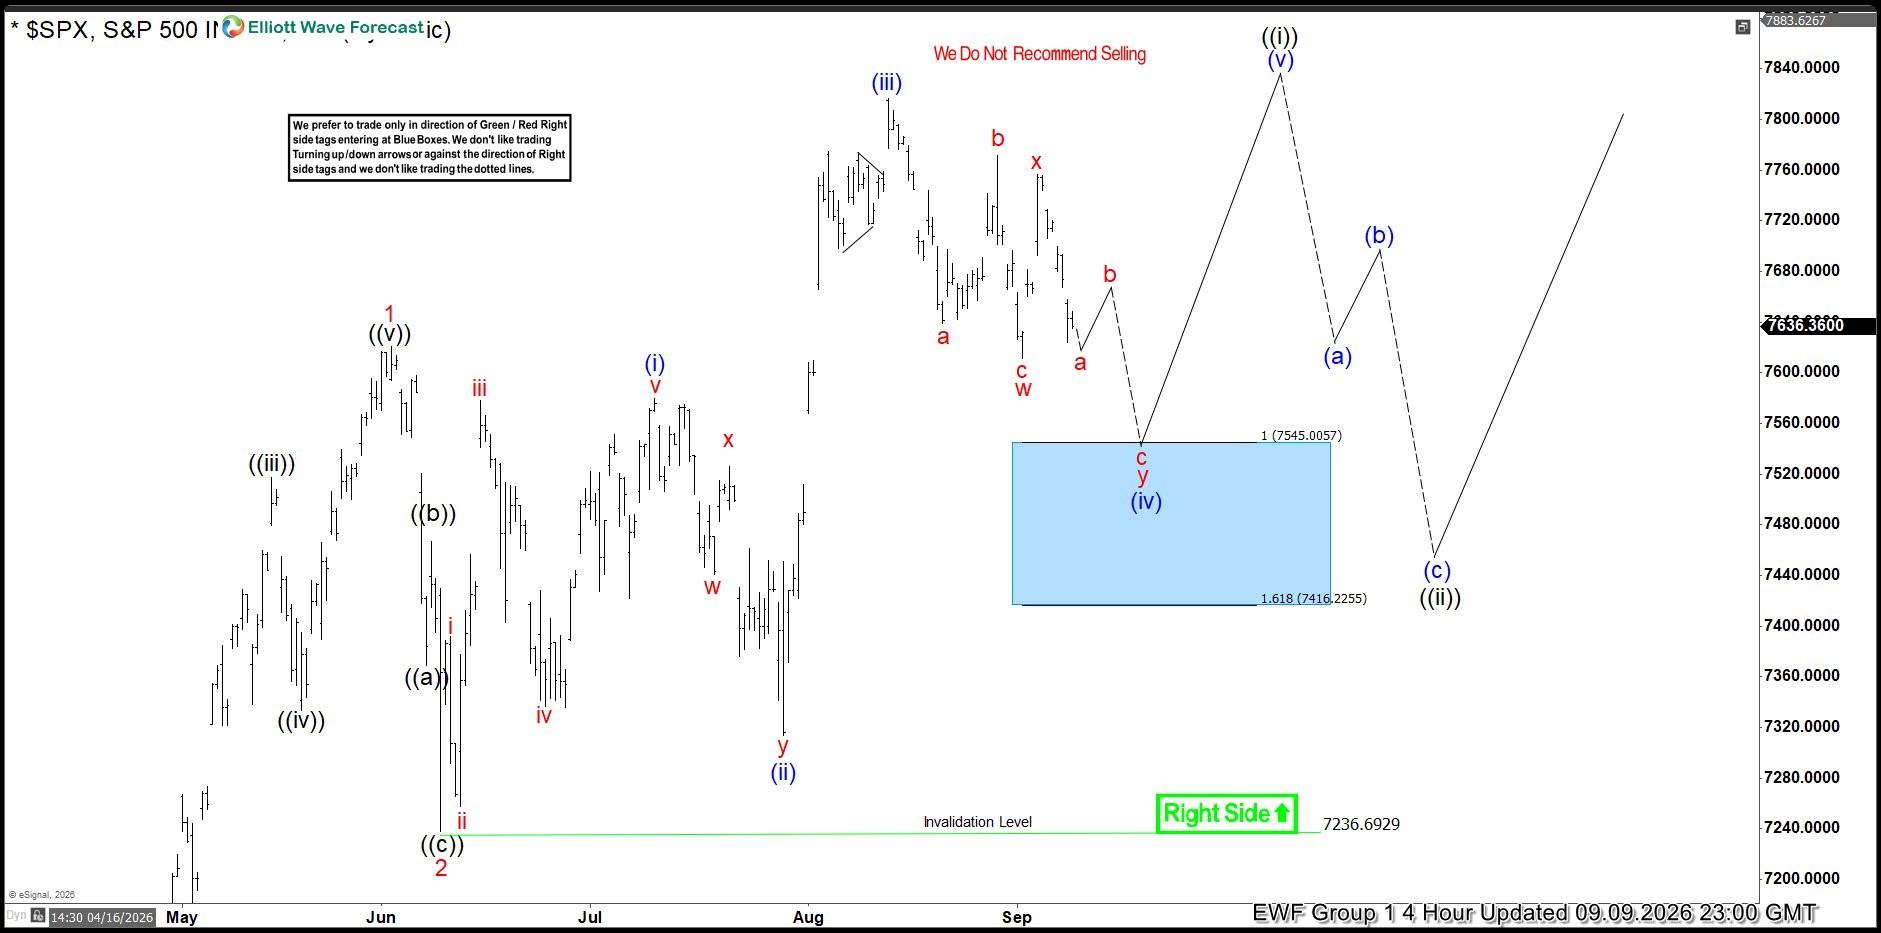
SPX Elliott Wave one-hour chart – 09.09.2026
SPX is forming a three-wave pullback from the recent high, and the correction still appears incomplete. We expect another leg lower toward the 7545–7416 area.
At this stage, we are not looking to sell SPX. Instead, our focus remains on the long side. With the broader trend still bullish, we expect buyers to step in around the marked Blue Box area. From there, SPX could start at least a three-wave bounce, with the potential to extend higher and eventually make new highs. A break below the 1.618 Fibonacci Extension at 7416 would invalidate this setup.
This is the type of opportunity we look for every day for our members: a defined entry zone, a clear invalidation level, and a plan for managing the trade as the market moves in our favor.
Instead of chasing price or guessing where to enter, our members can follow these setups as they develop in real time.
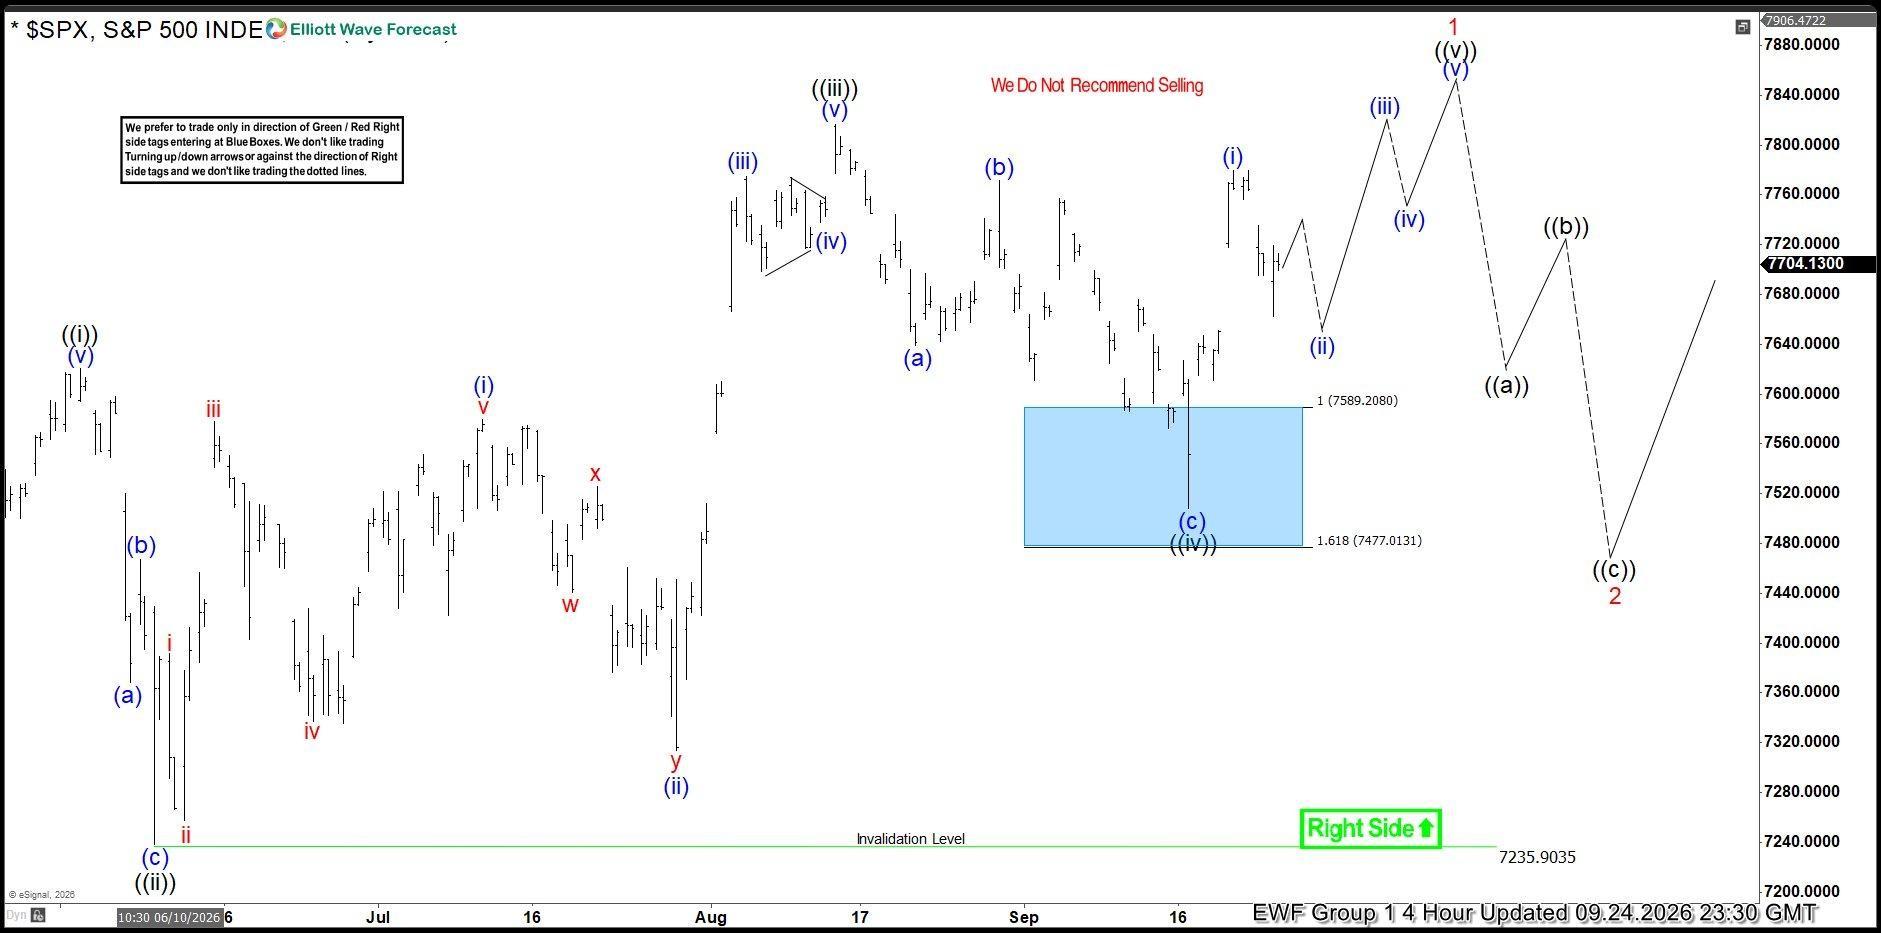
SPX Elliott Wave one-hour chart – 09.24.2026
The Index dropped into our buying zone (Blue Box) and found buyers as expected. The reaction from the zone delivered a solid bounce, and we now consider the correction complete at the 7507.44 low.
Our expectation is for SPX to continue higher and eventually break to new highs, with 7890 as the next target area.
Author

Elliott Wave Forecast Team
ElliottWave-Forecast.com
















