S&P500: Will Friday’s NFP report crash the market?

We track the S&P 500 (SPX) using the Elliott Wave (EW). The EW allows us to identify the potential paths the market can take based on known patterns, which must adhere to specific price-based rules. Since we cannot predict the future, the EW can help us identify the most likely path. Moreover, since financial markets are non-linear, stochastic, and probabilistic, we must, like any other discipline that forecasts complex systems, always “anticipate, monitor, and adjust if necessary.”
With that in mind, in our last update (see here), before the FED’s interest rate decision, our view was that the announcement would not crash the market as our preferred forecast is for a complex, overlapping ending diagonal (ED) to SPX6000+. We anticipate that
“green W-a/1 of the red W-iii/c to be completed soon, and the green W-b/2 to ideally $5525+/25 should be underway from where the green W-3/c to ideally $5950+/-25 can kick in.”
Fast-forward and all we got was $5615, a mere 23.60% retracement of the rally that started September 6. See Figure 1 below. The shallow retracement fell short of the typical 50.0-76.0% retracement, which we based our forecast on, but uncommon does not equal impossible. However, the index has increased since then, supporting our “ED-to-$6000+” thesis. Thus, we will now look at the current price chart to see if Friday’s important US Nonfarm payroll (NFP) report can crash the stock market. See Figure 1 below.
Figure 1. Daily SPX chart with detailed EWP count and technical indicators
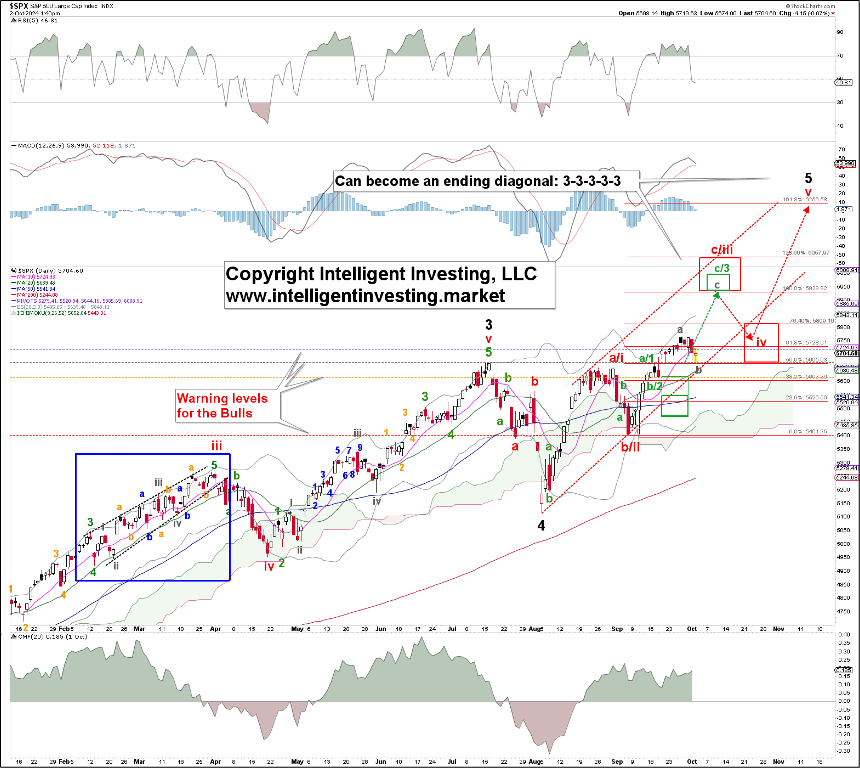
Our preferred assessment of the price action (since the infamous October 2022 low) remains that the index completed the (black) major W-3 and W-4 this summer and is now working on the black W-5. The latter appears to form a (contracting) ending diagonal (ED) pattern. EDs comprise a 3-3-3-3-3 pattern and are, therefore, initially indistinguishable from a correction: a 3-3-3 pattern. Thus, it takes time to be confident that the SPX is in an ED.
The index also formed an ED during the February-March rally. See the blue box in Figure 1, which illustrates its overlapping abc’s well. We should, therefore, expect something similar over the next few months but on a grander scale, as that was a (green) minor-5 wave, and the current rally should be a two-degree larger Major wave.
With that in mind, we expect the green W-a/1 and b/2 of the red W-iii/c to be complete and the green W-3/c to ideally SPX5950+/-25 to be underway. The latter may subdivide as shown in the one-degree lower grey W-a, -b, and—c. The Bears have been able to break price below the continuously raised (blue) warning level for the Bulls but have, so far, stalled at the grey, 2nd warning level. The Bulls will be in more trouble on a break below that level and especially below the orange, 3rd warning, level at the FED-Wednesday low of $5615, as that increases the odds that the market can go below the September 6 low at $5402. Namely, since markets are—as said—complex systems, we must always be aware that our assessment could be wrong. Thus, the rally from the August 5 low could also be a protracted three-wave rally—a corrective B-wave. See Figure 2 below.
Figure 2. Daily SPX chart with detailed EWP count and technical indicators
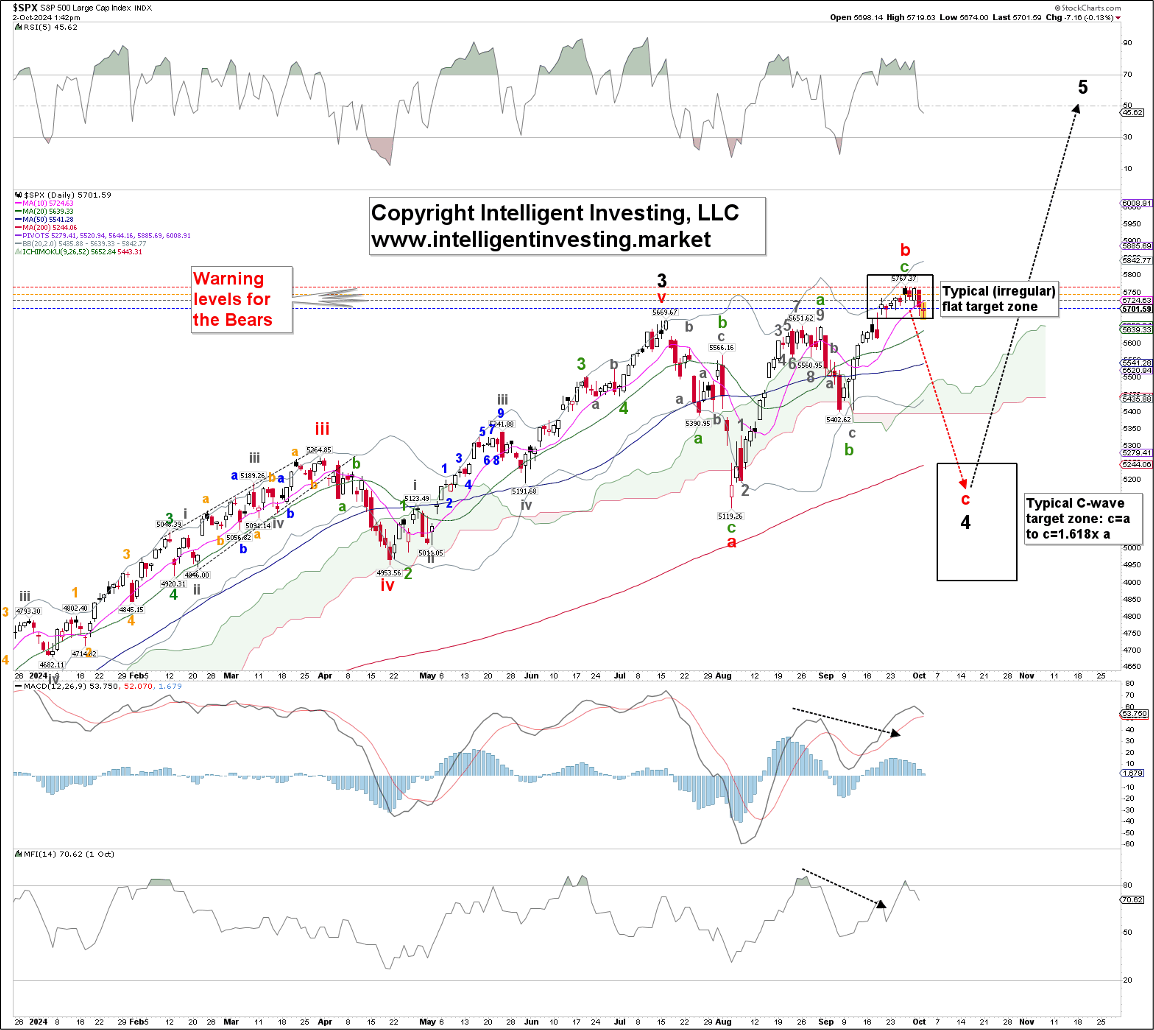
Our previous update showed that “the black W-4 [can] morph into a flat correction. A flat correction often has a=b=c; thus, the red W-c can drop back to the $5100 level.” We still cannot exclude this possibility since the index has reached the typical target zone for the B-wave of an (irregular) flat: b=a to b=1.236x a. Hence, a protracted 5-3-5, a-b-c pattern can have been completed last week’s high.
However, it requires a break below the September 6 low, with a severe warning below $5490, to tell us that will be the case. From there, the black W-5 can start. However, this remains our alternative view, “insurance policy,” as the index is still trending higher.
In our last update, we concluded, “…unless we are entirely mistaken, one way or another, we don’t see the FED’s rate decision crash the market,” which was the correct foresight. Thanks to the EW, we know that after W-4 comes W-5, so we still see the worst-case scenario as a correction back to ~$5100+/-200. In contrast, the anticipated drop to ideally $5525+/25 fell short at $5615. Still, the forecasted subsequent rally to potentially as high as $6000 should be underway, contingent on holding above the September 6 low at $5402.
Author

Dr. Arnout Ter Schure
Intelligent Investing, LLC
After having worked for over ten years within the field of energy and the environment, Dr.