Silver Price Forecasts: XAG/USD holds below $ 61.00 amid US Dollar strength
- XAG/USD found support around $60.50, but it seems unable to return above $61.00.
- The precious metal remains on the defensive with the US Dollar Index on track for a 2% monthly rally.
- Price action has broken the neckline of a large Head & Shoulders pattern.
Silver (XAG/USD) remains practically flat on Tuesday, trading at its lowest levels in nearly two months on Tuesday, around $60.80, failing to find follow-through above $61.00 and on track for a 8.5% monthly selloff in September. Precious metals are struggling, as the US Dollar surges with long-term yields at multi-decade highs and markets pricing in at least one more Federal Reserve (Fed) rate hike in Q4.
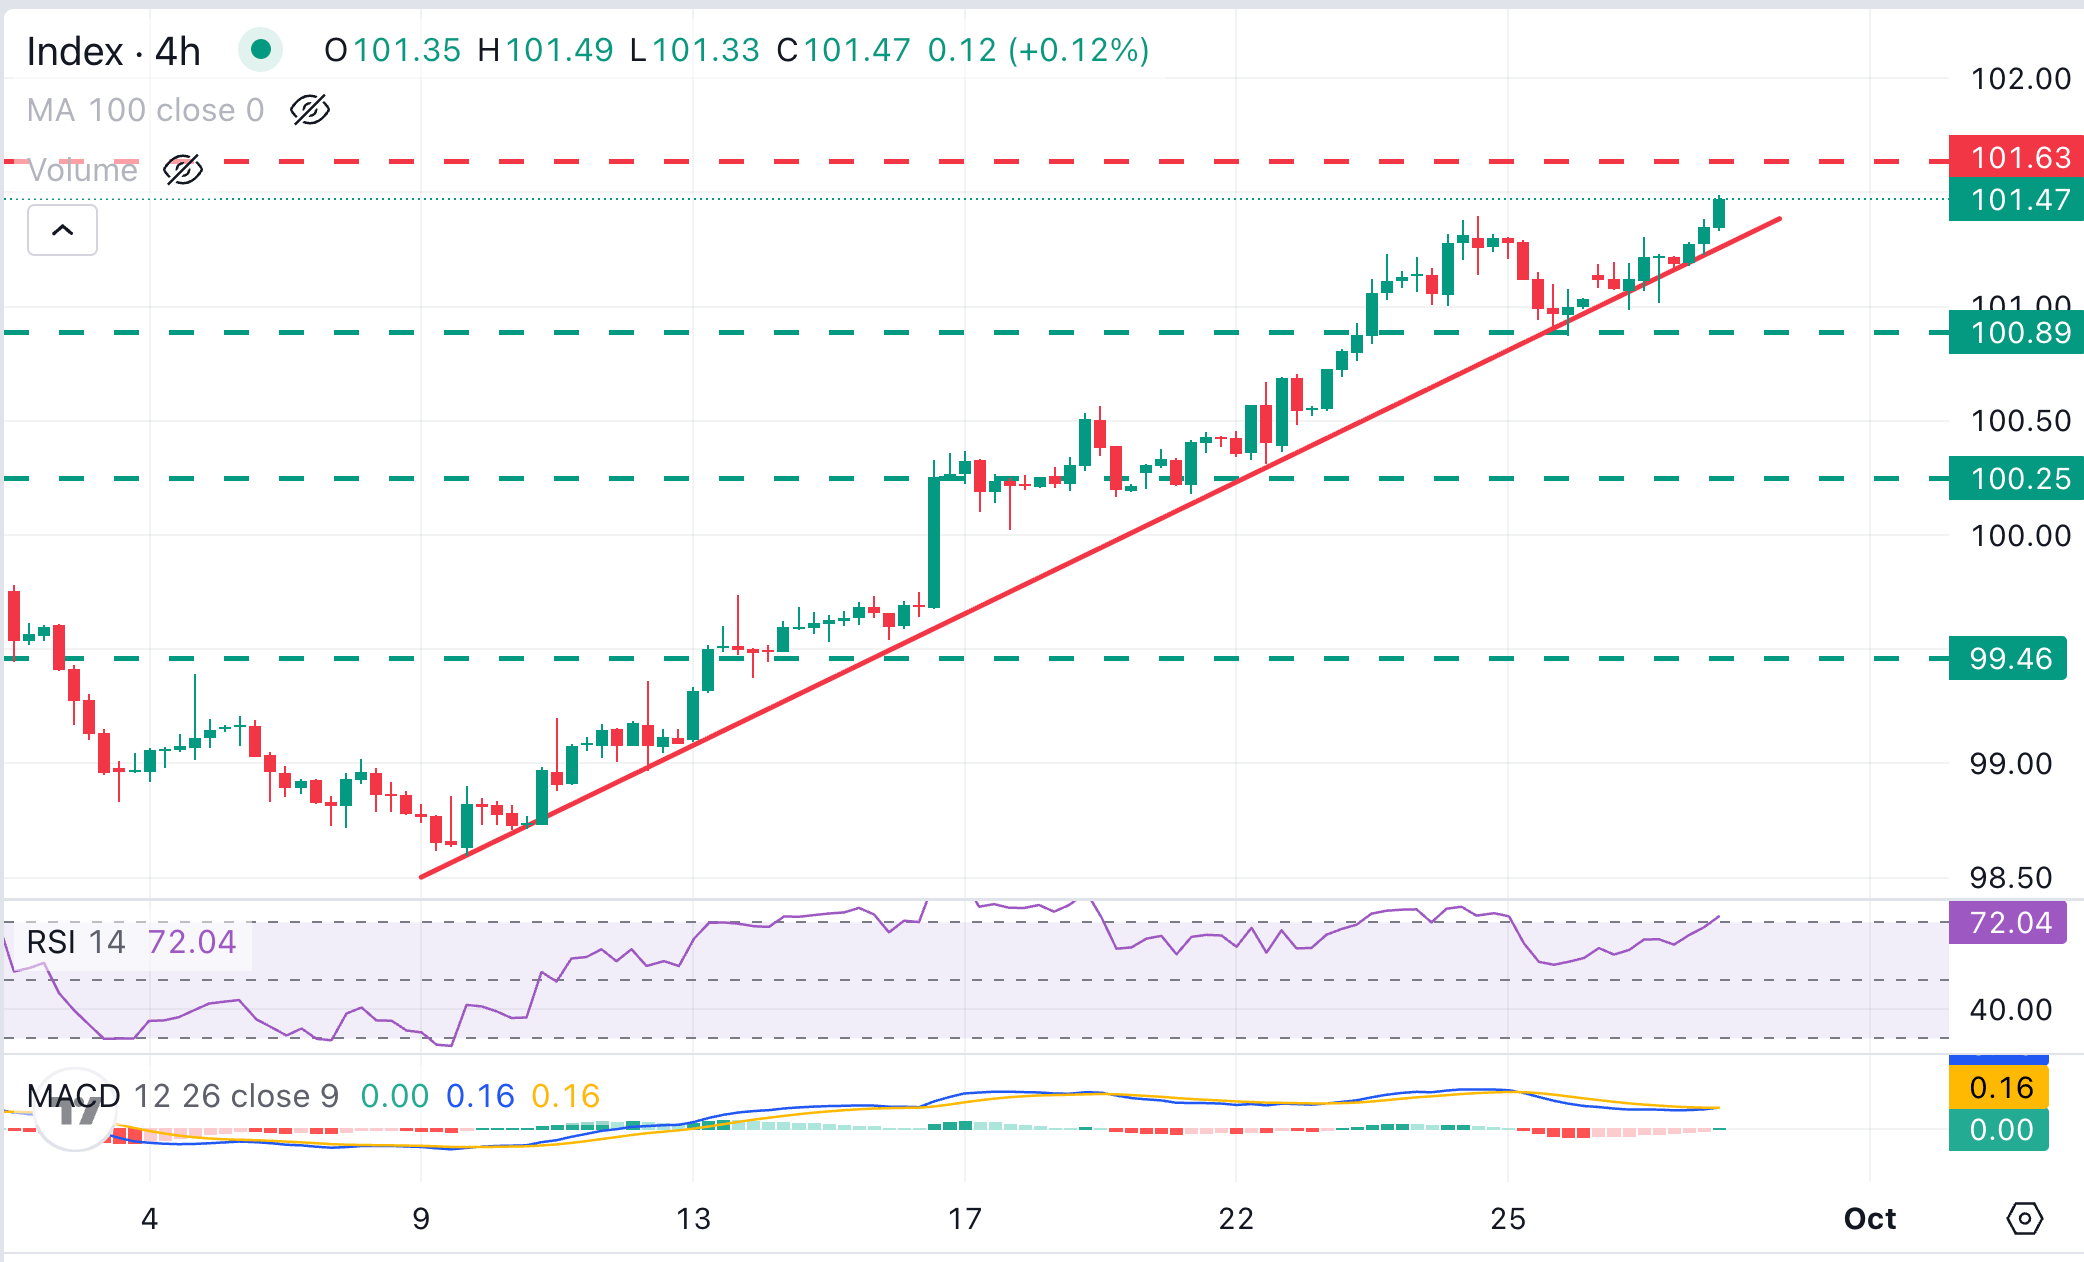
The USD Index, which measures the value of the Greenback against a basket of six majors, is trading at 101.37 after hitting its highest level in more than one year, at 101.49. The hawkish Fed repricing has fuelled a nearly 2% USD rally in September, which explains precious metals’ decline, amid their negative correlation with the Greenback.
John Velis, analyst at BNY Markets, affirms that “instead of long-term inflation driving yields higher, it was ironically perceptions of central bank credibility – markets are expecting the Fed (and other central banks) to raise rates in response to rising inflation.” In other words, the market is pricing in confidence that policymakers will respond forcefully to any renewed price pressures, pushing real yields up even as longer-term inflation expectations remain relatively contained, and weighing heavily on precious metals.
Technical Analysis: Price action breaks below the H&S's neckline
XAG/USD's impulsive reversal printed on Tuesday broke the neckline of a bearish Head & Shoulders (H&S) pattern, at the $62.20 area. Momentum indicators in the daily chart reinforce the bearish view, as the Relative Strength Index (14) slides below 40, and the Moving Average Convergence Divergence (MACD) indicator steadies within negative territory.
Bears are pushing against support around the September 9 low of $60.87. Further down, the next target might be the September 8 low, at the $59.30 area, and the 78.6% Fibonacci retracement of the July - August rally, at $58.15. The H&S's measured target lies below the year-to-date low at $54.71
On the topside, initial resistance is seen at the mentioned H&S neckline, just above $62.20. A break of this level would be needed to ease bearish pressure and shift the focus towards the September 5 high, in the $65.00 area.
(The technical analysis of this story was written with the help of an AI tool. Know more.)
Silver FAQs
Silver is a precious metal highly traded among investors. It has been historically used as a store of value and a medium of exchange. Although less popular than Gold, traders may turn to Silver to diversify their investment portfolio, for its intrinsic value or as a potential hedge during high-inflation periods. Investors can buy physical Silver, in coins or in bars, or trade it through vehicles such as Exchange Traded Funds, which track its price on international markets.
Silver prices can move due to a wide range of factors. Geopolitical instability or fears of a deep recession can make Silver price escalate due to its safe-haven status, although to a lesser extent than Gold's. As a yieldless asset, Silver tends to rise with lower interest rates. Its moves also depend on how the US Dollar (USD) behaves as the asset is priced in dollars (XAG/USD). A strong Dollar tends to keep the price of Silver at bay, whereas a weaker Dollar is likely to propel prices up. Other factors such as investment demand, mining supply – Silver is much more abundant than Gold – and recycling rates can also affect prices.
Silver is widely used in industry, particularly in sectors such as electronics or solar energy, as it has one of the highest electric conductivity of all metals – more than Copper and Gold. A surge in demand can increase prices, while a decline tends to lower them. Dynamics in the US, Chinese and Indian economies can also contribute to price swings: for the US and particularly China, their big industrial sectors use Silver in various processes; in India, consumers’ demand for the precious metal for jewellery also plays a key role in setting prices.
Silver prices tend to follow Gold's moves. When Gold prices rise, Silver typically follows suit, as their status as safe-haven assets is similar. The Gold/Silver ratio, which shows the number of ounces of Silver needed to equal the value of one ounce of Gold, may help to determine the relative valuation between both metals. Some investors may consider a high ratio as an indicator that Silver is undervalued, or Gold is overvalued. On the contrary, a low ratio might suggest that Gold is undervalued relative to Silver.
Author

Guillermo Alcala
FXStreet
Graduated in Communication Sciences at the Universidad del Pais Vasco and Universiteit van Amsterdam, Guillermo has been working as financial news editor and copywriter in diverse Forex-related firms, like FXStreet and Kantox.

















