|

S&P 500 ($SPX) forecasting the path

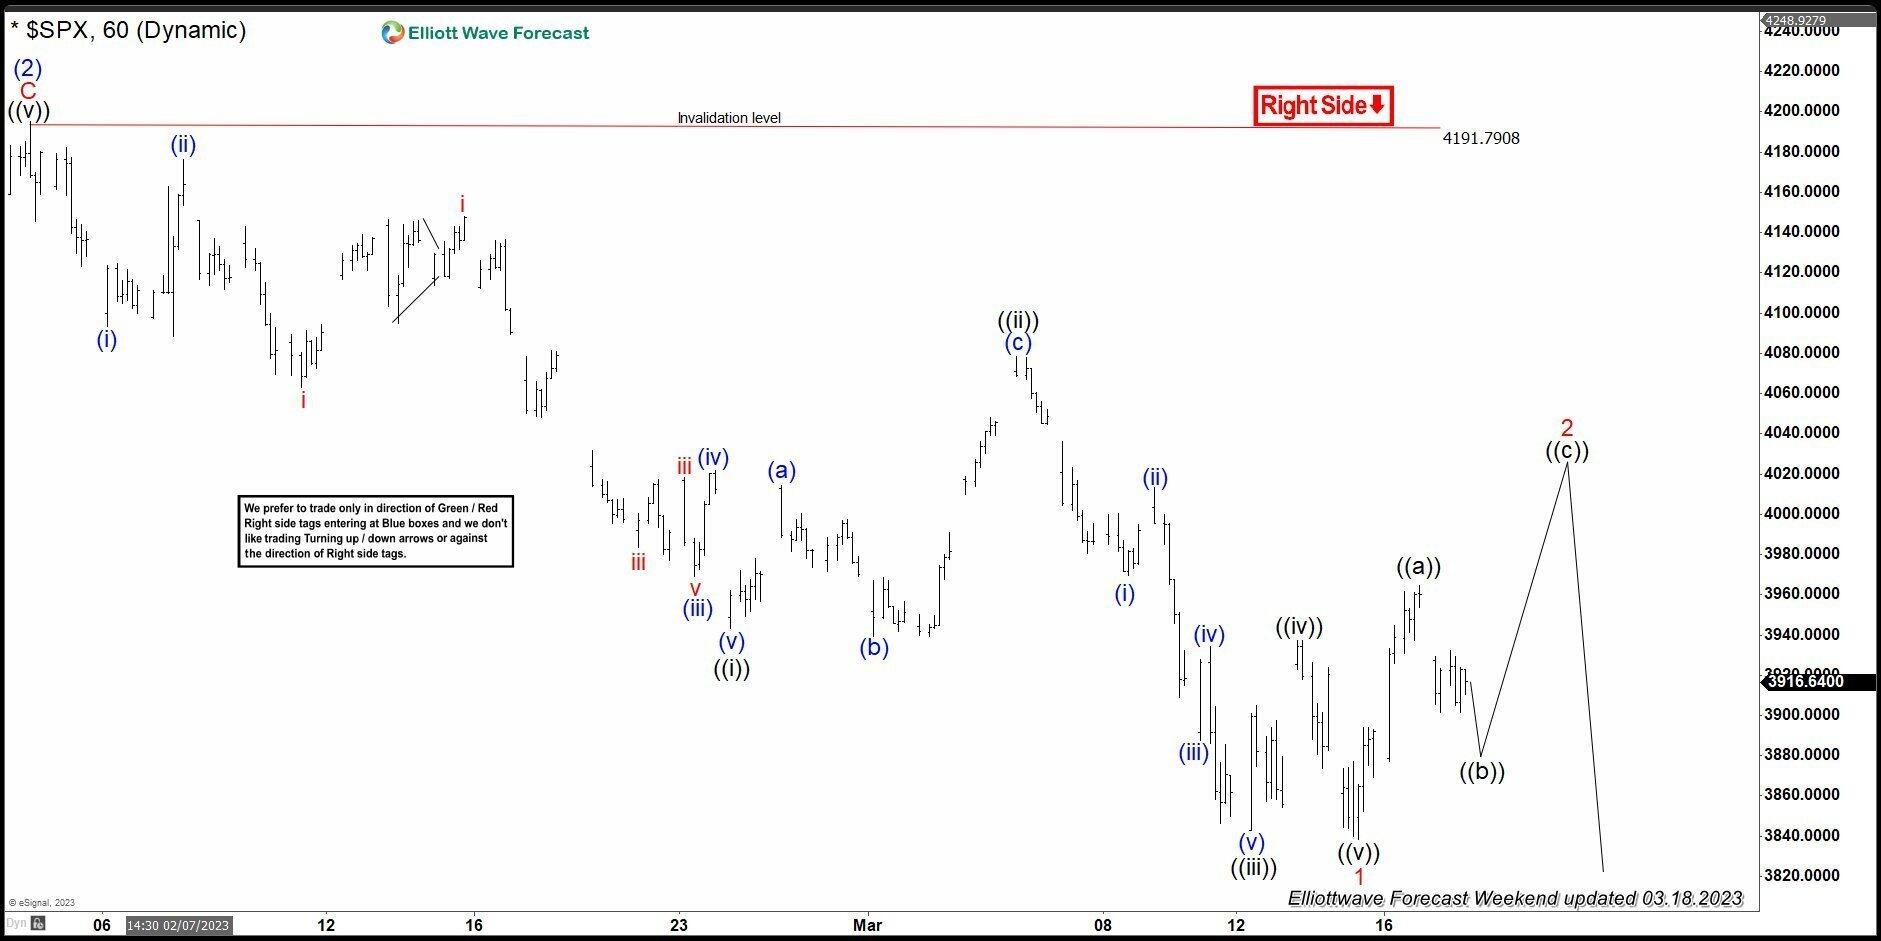
Hello fellow traders. In this article we’re going to take a quick look at the Elliott Wave charts of S&P 500 ( SPX) published in members area of the website.  As our members know SPX is showing incomplete structure in the cycle from the January 2022 peak, calling for potential extension lower.  Recently we got a 3 waves bounce that completed right at the extreme zone as we expected. In the further text we are going to explain the Elliott Wave Forecast. SPX Elliott Wave 1  Hour  Chart 03.18.2023

We are calling cycle from the 4191.79 peak completed as 5 waves structure. Currently SPX is doing correction against the mentioned high. For now we can count only 5 waves up from the low, which means recovery is potentially unfolding as Elliott Wave Zig Zag Pattern . We expect to see another push up, before further decline continues. We would like to see break above previous short term high ((a)) black to confirm proposed view.

Chart

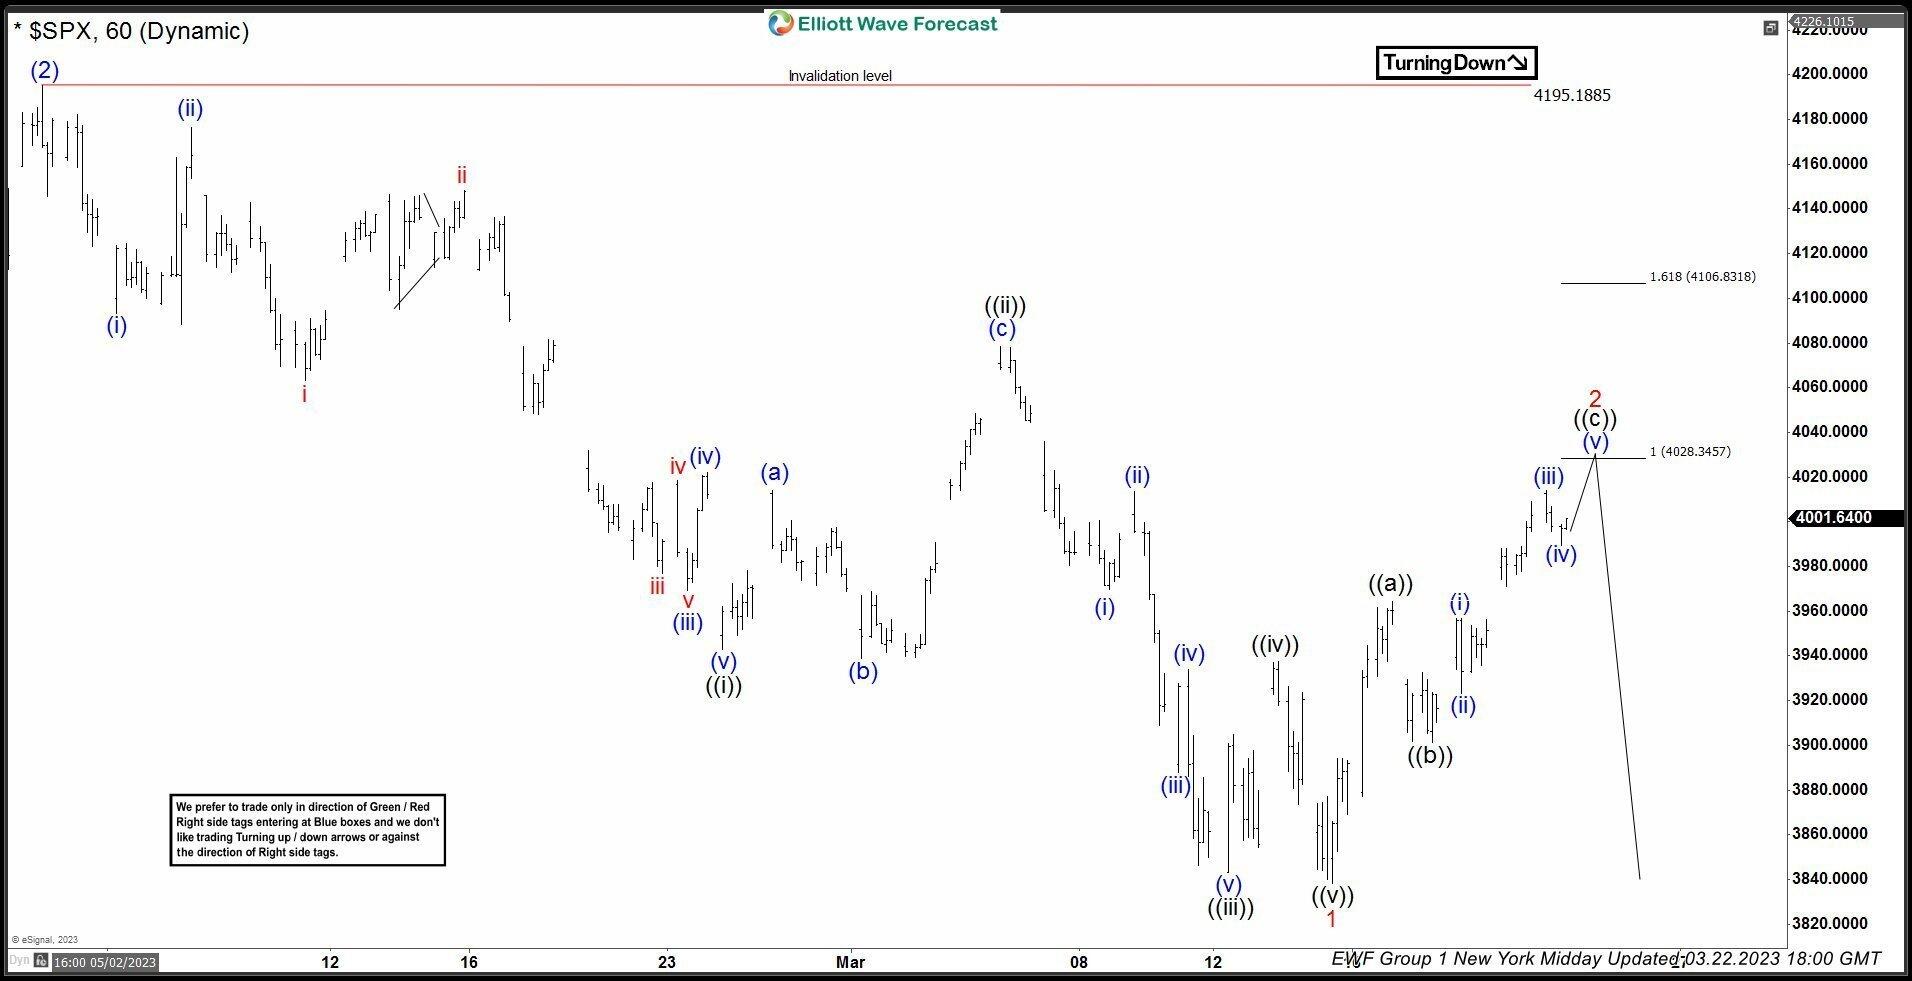
SPX Elliott Wave 1 Hour Chart 03.22.2023

The index break above previous peak ((a)) black and continued trading higher as expected. Now, when we have a connector ((b)) low, we are able to measure potential target for 3 waves recovery. We expect correction to complete at 4028.34-4106.83 area.  At that zone we believe buyers will be taking profits and sellers will appear. From there we expect to see either further decline toward new lows, or 3 waves pull back alternatively.

Chart

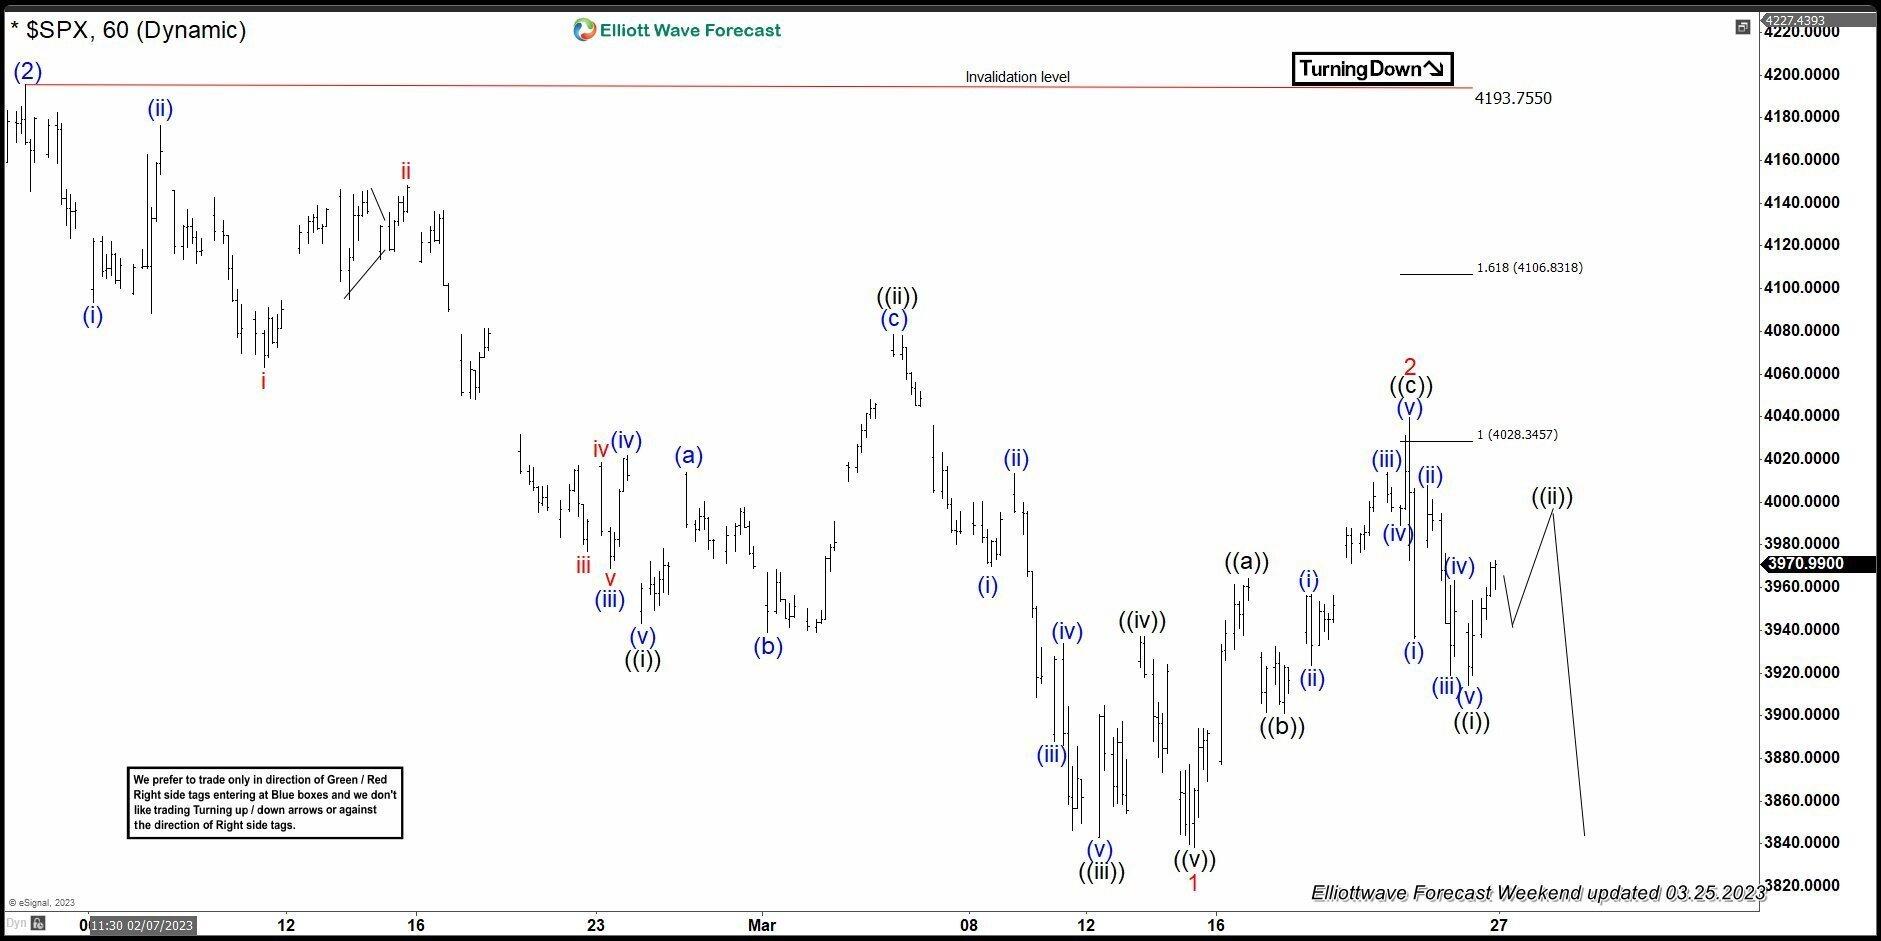
SPX Elliott Wave 1 Hour Chart 03.23.2023

SPX reached our target area 4028.34-4106.83 and found sellers as expected. We got very nice reaction from there. Current view suggests correction can be done at 4039.24 high. That is the key level for proposed short term count. As far as the price stays below that high, continuation lower is favored. Otherwise break above 4039.24 would mean, extension within the short term recovery against the 4193.75 high. In that case SPX could see more upside toward 4132.9+ area.

Keep in mind that market is dynamic and presented view could have changed in the mean time. 

Chart

Premium

You have reached your limit of 3 free articles for this month.

Start your subscription and get access to all our original articles.

Subscribe to PremiumSign In

Author

Elliott Wave Forecast Team

Elliott Wave Forecast Team

ElliottWave-Forecast.com

More from Elliott Wave Forecast Team
Share:

Markets move fast. We move first.

Orange Juice Newsletter brings you expert driven insights - not headlines. Every day on your inbox.

By subscribing you agree to our Terms and conditions.

Editor's Picks

EUR/USD gathers strength above 1.1750 as Fed rate cut prospects pressure US Dollar

The EUR/USD pair trades in positive territory around 1.1775 during the early Asian session on Monday. The prospect of a US Federal Reserve rate cut in 2026 weighs on the US Dollar against the Euro. Markets brace for US President Donald Trump to nominate a Fed chair to replace Jerome Powell, whose term ends in May. 

GBP/USD edges lower near 0.7400, eyes Fed rate cut outlook

GBP/USD edges lower after a gap-up open, trading around 0.7410 during the Asian hours on Monday. However, the pair may gain ground as the US Dollar faces challenges, which could be attributed to growing expectations of two more rate cuts by the Federal Reserve in 2026.

Gold retreats from record highs, heads toward $4,550

Gold retreats after setting a new record-high at $4,550 earlier in the Asian session on Monday and eases toward $4,500 as trading volumes thin out ahead of the New Year break. The US Dollar bearish bias remains unabated on the back of dovish Fed expectations, which continues to act as a tailwind for the bullion amid persistent geopolitical risks.

Ethereum Annual Price Forecast: ETH poised for growth in 2026 amid regulatory clarity and institutional adoption

Ethereum lost 12% of its value in 2025, declining from $3,336 at the beginning of the year to $2,930 as of the third week of December, a stark contrast from 2024's 48% gain. But that percentage doesn't do justice to the wild year ETH had in 2025.

Economic outlook 2026-2027 in advanced countries: Solidity test

After a year marked by global economic resilience and ending on a note of optimism, 2026 looks promising and could be a year of solid economic performance. In our baseline scenario, we expect most of the supportive factors at work in 2025 to continue to play a role in 2026.

Avalanche struggles near $12 as Grayscale files updated form for ETF

Avalanche trades close to $12 by press time on Wednesday, extending the nearly 2% drop from the previous day. Grayscale filed an updated form to convert its Avalanche-focused Trust into an ETF with the US Securities and Exchange Commission.