|

S&P500 Price Analysis: Largest daily advance in one decade after major selloff, trades near 2700 level

  • S&P500 rebounds sharply after seeing worst selloff since 1987 on Thursday. 
  • Resistances are seen at the 2700 and 3100 price levels.
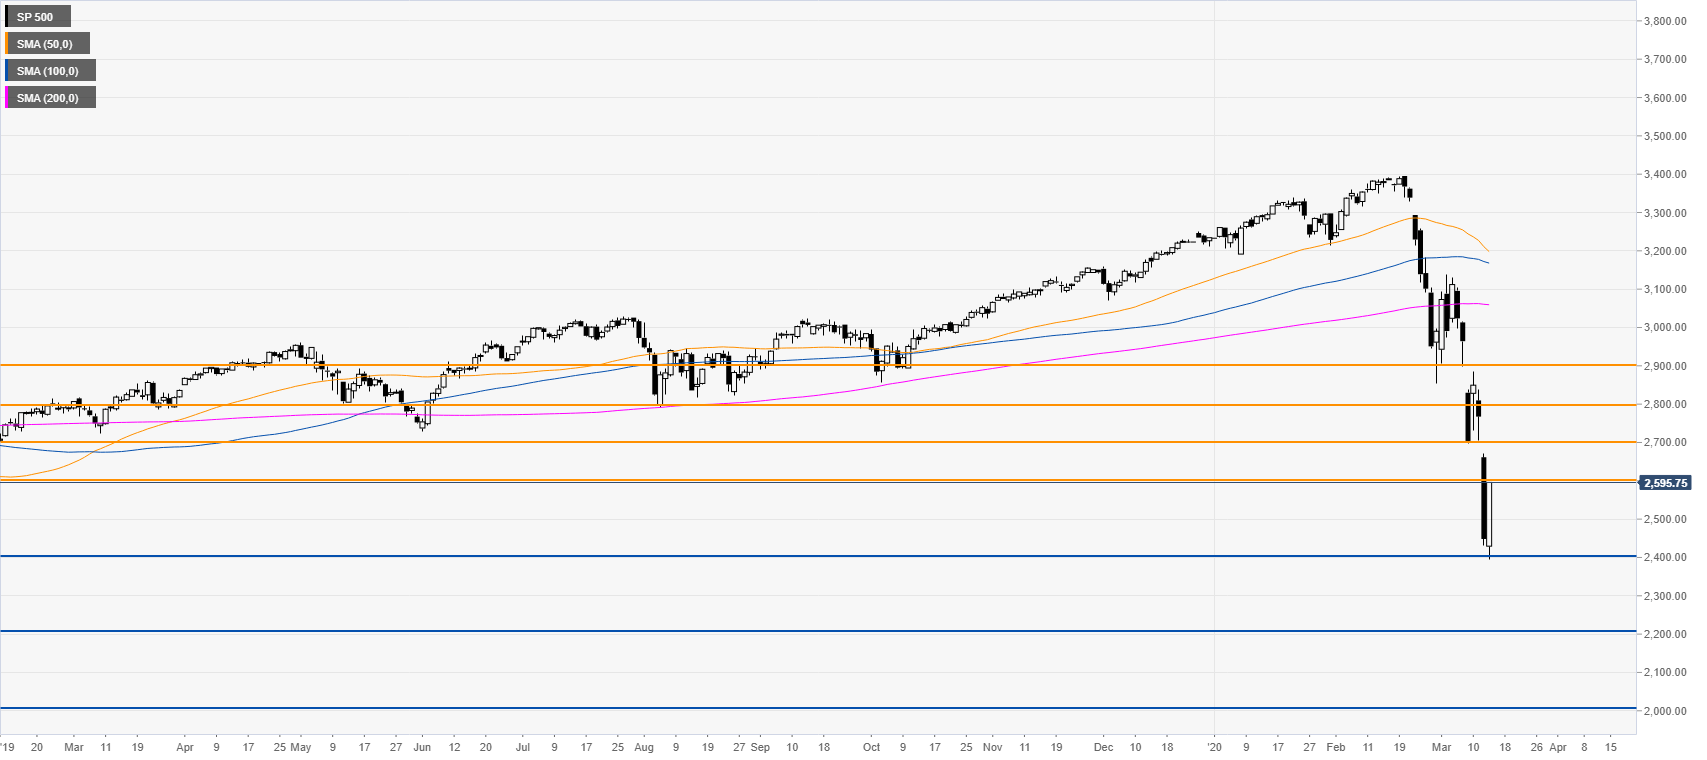
 

S&P500 daily chart

 
The S&P500 Index is retracing back up sharply following one of the worst days in history on Thursday as the Coronavirus is spreading fear. As the market is pulling back up, the index could climb towards the 2900 and 3100 price levels in the coming sessions. However, as the S&P500 remains fragile the move up may end up being a dead-cat bounce if the 2400 support fails to hold prices.  
 

Additional key levels 

SP 500

Overview
Today last price2698
Today Daily Change249.75
Today Daily Change %10.20
Today daily open2448.25
 
Trends
Daily SMA203078.92
Daily SMA503210.86
Daily SMA1003172.09
Daily SMA2003060.77
 
Levels
Previous Daily High2670
Previous Daily Low2431.5
Previous Weekly High3137
Previous Weekly Low2899.25
Previous Monthly High3395.25
Previous Monthly Low2854.5
Daily Fibonacci 38.2%2522.61
Daily Fibonacci 61.8%2578.89
Daily Pivot Point S12363.17
Daily Pivot Point S22278.08
Daily Pivot Point S32124.67
Daily Pivot Point R12601.67
Daily Pivot Point R22755.08
Daily Pivot Point R32840.17

Author

Flavio Tosti

Flavio Tosti

Independent Analyst


More from Flavio Tosti
Share:

Editor's Picks

EUR/USD eyes nine-day EMA barrier after rebounding from 1.1600

EUR/USD gains ground after registering modest losses in the previous session, trading around 1.1620 during the Asian hours on Friday. The technical analysis of the daily chart suggests an ongoing bearish bias as the pair remains within the descending channel pattern.

GBP/USD: Pound Sterling ticks up against US Dollar in countdown to US NFP

The Pound Sterling trades marginally higher to near 1.3365 against the US Dollar during the Asian trading session on Friday. The GBP/USD pair edges up as the US Dollar ticks down ahead of the United States Nonfarm Payrolls data for February, which will be published at 13:30 GMT.

Gold rises but remains on track for weekly loss in five weeks

Gold price recovers its recent losses from the previous session on Friday. The yellow metal advances as the broader precious metals market rebounds on safe-haven demand. However, the yellow metal is on track for its first weekly decline in five weeks as escalating Middle East tensions push oil prices higher, fueling inflation concerns and reducing bets on Federal Reserve rate cuts.

Bitcoin, Ethereum and Ripple at risk as US-Iran war extends

Bitcoin, Ethereum, and Ripple trade cautiously at press time on Friday, close to key support levels after a roughly 2% pullback the previous day. Bitcoin holds above $71,000, Ethereum at $2,000, and XRP continues to consolidate in a sideways range.

The market compass is pointing at a barrel of Oil

The Asian open is arriving with equities leaning the wrong way, and the reason is not complicated. The market’s compass needle has snapped firmly toward crude. In this tape, oil is not just another input price; it is the gravitational center around which every asset class is orbiting.

Ripple tests recovery strength amid steady ETF inflows, growing retail interest

Ripple (XRP) continues to demonstrate notable resilience as the cryptocurrency market navigates the persistent war in the Middle East after the United States (US) and Israel attacked Iran on Saturday.