S&P/TSX 60 Index Elliott Wave technical analysis [Video]
![S&P/TSX 60 Index Elliott Wave technical analysis [Video]](https://editorial.fxsstatic.com/images/i/Equity-Index_S&P500-1_XtraLarge.jpg)
S&P/TSX 60 Elliott Wave technical analysis
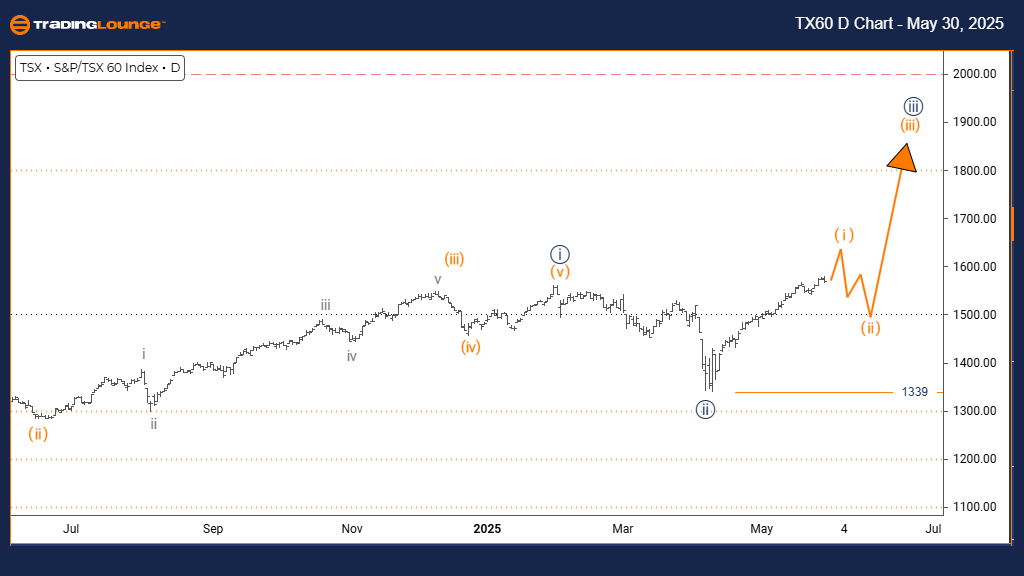
Function: Bullish Trend.
Mode: Impulsive.
Structure: Orange Wave 1.
Position: Navy Blue Wave 3.
Direction next lower degrees: Orange Wave 2.
Details: Navy Blue Wave 2 appears complete; Orange Wave 1 of 3 is now in play.
Wave cancel/invalidation level: 1339.
The daily chart analysis indicates a strong bullish scenario for the S&P/TSX 60 index as it progresses into a new impulsive structure. Currently, Orange Wave 1 is forming within the larger Navy Blue Wave 3, suggesting the previous correction of Navy Blue Wave 2 has completed, paving the way for an extended upward leg.
The confirmation of Navy Blue Wave 2’s completion signals that bullish momentum is building. Orange Wave 1 is gaining traction, displaying early signs of a powerful bullish impulse. A key invalidation level is set at 1339; any drop below this would require reevaluating the wave structure or acknowledging a more complex correction.
This outlook offers traders valuable positioning insight during a likely profitable early phase. With further upside expected before the next correction (Orange Wave 2), market participants should monitor momentum and price behavior while applying disciplined risk control as the structure unfolds.
S&P/TSX 60 Elliott Wave analysis – Day chart
S&P/TSX 60 Elliott Wave technical analysis
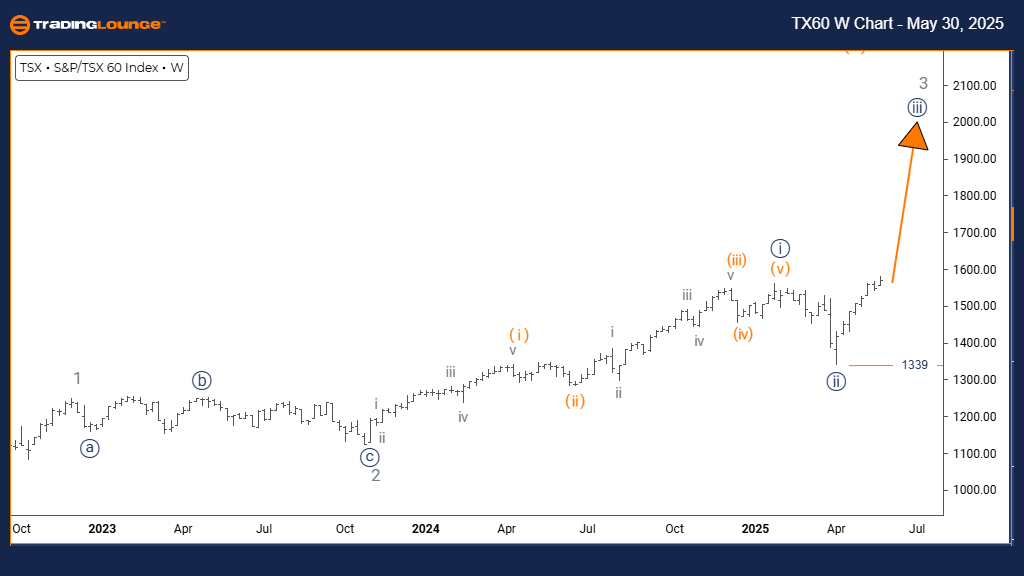
Function: Bullish Trend
Mode: Impulsive
Structure: Navy Blue Wave 3
Position: Gray Wave 3
Direction next lower degrees: Navy Blue Wave 4
Details: Navy Blue Wave 2 appears complete; Navy Blue Wave 3 of 3 is now in play.
Wave cancel/invalidation level: 1339.
The weekly chart presents a robust bullish view for the S&P/TSX 60, showing impulsive price action typical of a major third wave. Navy Blue Wave 3 is now developing within a broader bullish framework labeled as Gray Wave 3, following the successful completion of Navy Blue Wave 2’s corrective phase.
This suggests the index is now entering the most aggressive segment of the bullish trend. The impulsive behavior signals institutional interest and increasing buying strength. The 1339 level remains a critical invalidation threshold, helping to define the bullish scenario's risk boundary.
Investors should consider this a favorable phase in the Elliott sequence, where Wave 3 often delivers the most substantial gains. Anticipation of Navy Blue Wave 4, a corrective follow-up, should inform position sizing and risk management strategies as the rally matures.
S&P/TSX 60 Elliott Wave analysis – Weekly chart
S&P/TSX 60 Index Elliott Wave technical analysis [Video]
Author

Peter Mathers
TradingLounge
Peter Mathers started actively trading in 1982. He began his career at Hoei and Shoin, a Japanese futures trading company.


