S&P 500: Zoom out, old highs are still the key

Back on February 5 we shared a weekly S&P 500 chart with one simple message: whenever stocks pull back, watch the old highs as new support. Nine months later, with the index down about 3% this week to around 7,350, that idea matters again.
When the market turns red, it's easy to get stuck on daily candles. Zoom out to the weekly chart, though, and the picture is much calmer. Since 2015, every major correction has found buyers near a previous high. In 2020 the crash stopped near the old highs at 2,135. In 2022 the bear market held around 3,388, the 2020 high. And in 2025 the drop bottomed near 4,809, the 2022 high. Each time old resistance turned into support, and each time the market went on to new all-time highs.
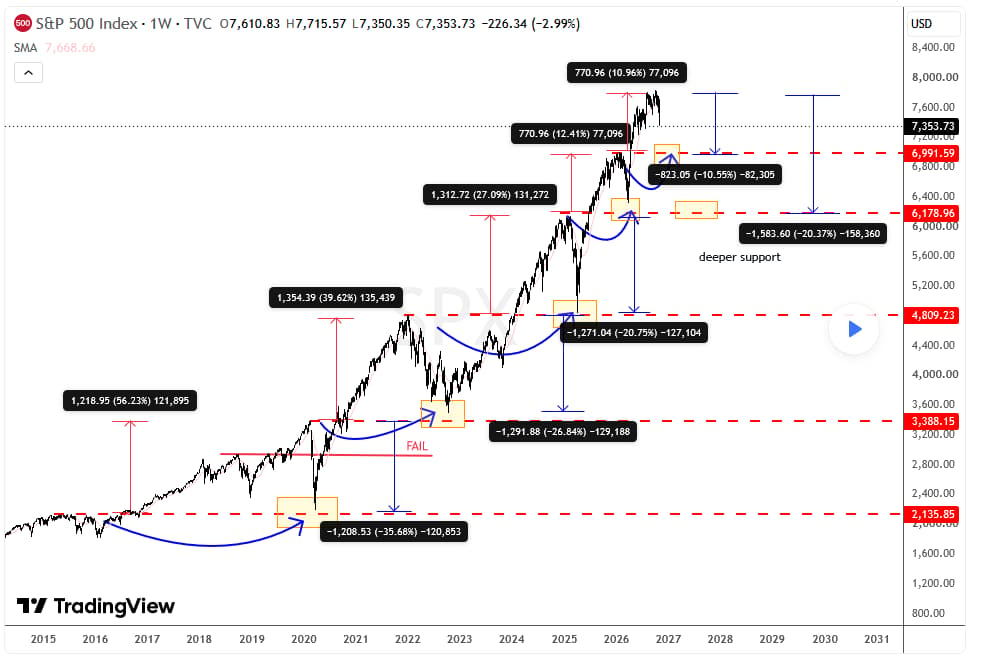
Now we're watching two levels. The first is 7,000, the previous high and the first major support, about 10.5% below the recent peak. The second is 6,000–6,200, the deeper support near another previous high and roughly a 20% correction. That's the same 6,177 area we marked back in February.
A break below 7,000 could open the door to a deeper drop, but that alone wouldn't end the longer-term bullish trend. Corrections feel scary while they're happening, but on a weekly chart they look like steps in a bigger uptrend. So instead of reacting to every headline, we're watching the levels that have mattered for over ten years.
Will history repeat itself? Previous highs have attracted buyers for over ten years, and they could matter again.
Get Full Access To Our Premium Elliott Wave Analysis For 14 Days. Click here.
Author

Gregor Horvat
Wavetraders
Experience Grega is based in Slovenia and has been in the Forex market since 2003.