S&P 500 Forecast: Index breaks above 4,325 resistance level ahead of CPI, FOMC
- S&P 500 has broken out of bear market, now awaits FOMC meeting.
- Fed Chair Jerome Powell and the FOMC board will make a decision on the fed funds rate on Wednesday.
- The market is heavily counting on a pause in rate hikes, CME’s FedWatch Tool shows a 76% probability of the Fed pausing.
- US CPI will be released on Tuesday with consensus for core inflation to drop to 5.3% YoY.

The S&P 500 index climbed 0.93% on Monday, breaking the 4,325 resistance barrier that has held up since August 16, 2023. S&P 500 futures have also gained 0.15% in Tuesday's premarket.
The vast majority of analysts, traders and observers expect the Federal Reserve (Fed) on Wednesday to pause its rate hiking cycle for the first time since it began raising interest rates back in the Spring of 2022. A pause would be bullish for stocks, and the S&P 500 ended its 18-month bear market last week in expectation of investment leaving the sidelines. Still, the Fed may be greatly influenced by data from the US Consumer Price Index (CPI) that arrives on Tuesday.
S&P 500 News: The bear is broken
Last Thursday, the S&P 500 officially ended its bear-market reign. This was in fact the longest bear market for the index since the one that lasted from the end of World War II until 1948. Approximately 18 months long in its entirety, the bear market lasted from January 4, 2022 until it was broken on June 8, 2023.
That was the session when the S&P 500 closed at 4,293 – just above the 20% market from its nadir on October 13 or last year. Bear markets are considered a fact once a stock or index drops 20% from its all-time high. To end the bear market, the stock or index needs to regain 20% off of its lowest point since the bear market began. That lowest point last October 13 was 27% off the January 4 high at 4,818. Both the Dow Jones and the NASDAQ have already ended their respective bear markets, so the same for the S&P 500 gives investors the idea that a true bull market is about to raise all boats.
Plenty of money that has been stashed away in money market funds and US Treasury bills may soon begin to seep back into the equity market, especially if the Federal Reserve does indeed pause on Wednesday. The fed funds rate is currently sitting in a range between 5% and 5.25%. CME’s FedWatch Tool gives a 24% probability that the Fed hikes rates to a range between 5.25% and 5.5% and a 76% chance that the central bank will leave the fed funds rate as is.
May US CPI is the only hurdle standing in Fed’s way
The one thing that could change the market’s – and the Fed’s – mind about interest rates is Tuesday’s May CPI data. Though it is not the most important survey the central bank uses, the CPI arriving on the first day of the two-day FOMC meeting could still have the effect of influencing the final decision.
Much higher Initial Jobless Claims reported last week and the Unemployment Rate rising from 3.4% to 3.7% has given most market participants the view that an easing labor market should give the Fed enough leeway to pause its hiking cycle. A much higher inflation signal on Tuesday would pretty much throw the market into chaos however.
Wall Street consensus expects core inflation in May to drop to 5.3% YoY from April’s 5.5% reading. This would mean another 0.4% MoM core reading. The headline figure is expected to demonstrate a much more pronounced pullback with the YoY figure dropping from April’s 4.9% to May’s 4.1% and rising just 0.2% MoM.
Inflation FAQs
What is inflation?
Inflation measures the rise in the price of a representative basket of goods and services. Headline inflation is usually expressed as a percentage change on a month-on-month (MoM) and year-on-year (YoY) basis. Core inflation excludes more volatile elements such as food and fuel which can fluctuate because of geopolitical and seasonal factors. Core inflation is the figure economists focus on and is the level targeted by central banks, which are mandated to keep inflation at a manageable level, usually around 2%.
What is the Consumer Price Index (CPI)?
The Consumer Price Index (CPI) measures the change in prices of a basket of goods and services over a period of time. It is usually expressed as a percentage change on a month-on-month (MoM) and year-on-year (YoY) basis. Core CPI is the figure targeted by central banks as it excludes volatile food and fuel inputs. When Core CPI rises above 2% it usually results in higher interest rates and vice versa when it falls below 2%. Since higher interest rates are positive for a currency, higher inflation usually results in a stronger currency. The opposite is true when inflation falls.
What is the impact of inflation on foreign exchange?
Although it may seem counter-intuitive, high inflation in a country pushes up the value of its currency and vice versa for lower inflation. This is because the central bank will normally raise interest rates to combat the higher inflation, which attract more global capital inflows from investors looking for a lucrative place to park their money.
How does inflation influence the price of Gold?
Formerly, Gold was the asset investors turned to in times of high inflation because it preserved its value, and whilst investors will often still buy Gold for its safe-haven properties in times of extreme market turmoil, this is not the case most of the time. This is because when inflation is high, central banks will put up interest rates to combat it.
Higher interest rates are negative for Gold because they increase the opportunity-cost of holding Gold vis-a-vis an interest-bearing asset or placing the money in a cash deposit account. On the flipside, lower inflation tends to be positive for Gold as it brings interest rates down, making the bright metal a more viable investment alternative.
Earnings of the week
Monday, June 12 - Oracle (ORCL)
Wednesday, June 14 - Lennar (LEN)
Thursday, June 15 - Adobe (ADBE), Kroger (KR)
What they said about the S&P 500 – David Koston
Goldman strategist David Koston announced that he is raising his S&P 500 year-end target to 4,500 from 4,000. Koston now expects a “general valuation re-rating” that will lift the multiples of a broad range of stocks closer to the valuations of the large mega caps that have provided much of the index’s rally this year.
"Our unchanged 2023 EPS forecast of $224 assumes a soft landing and is above the top-down consensus of $206.”
S&P 500 forecast
The S&P 500 retracted on Friday after touching the 4,325 resistance level that stems from August 2022. We have been focused on this price level for months, so it is fascinating to see how it has retained significance 10 months after its last familiarity.
Arguably, S&P 500 traders will want to see a close above this level for confirmation. There is plenty of support nearby though. The 9-day moving average is rising to last week’s supportive ledge that surrounded 4,265. The 21-day moving average is also not too far off at 4,200 – the top of the last resistance zone.
If the S&P 500 breaks through and closes above 4,325 this week, bulls will be expecting a steady move toward the 4,600 resistance area in the latter half of the year. That resistance zone pushed index price action down on multiple occasions during February and March of last year.
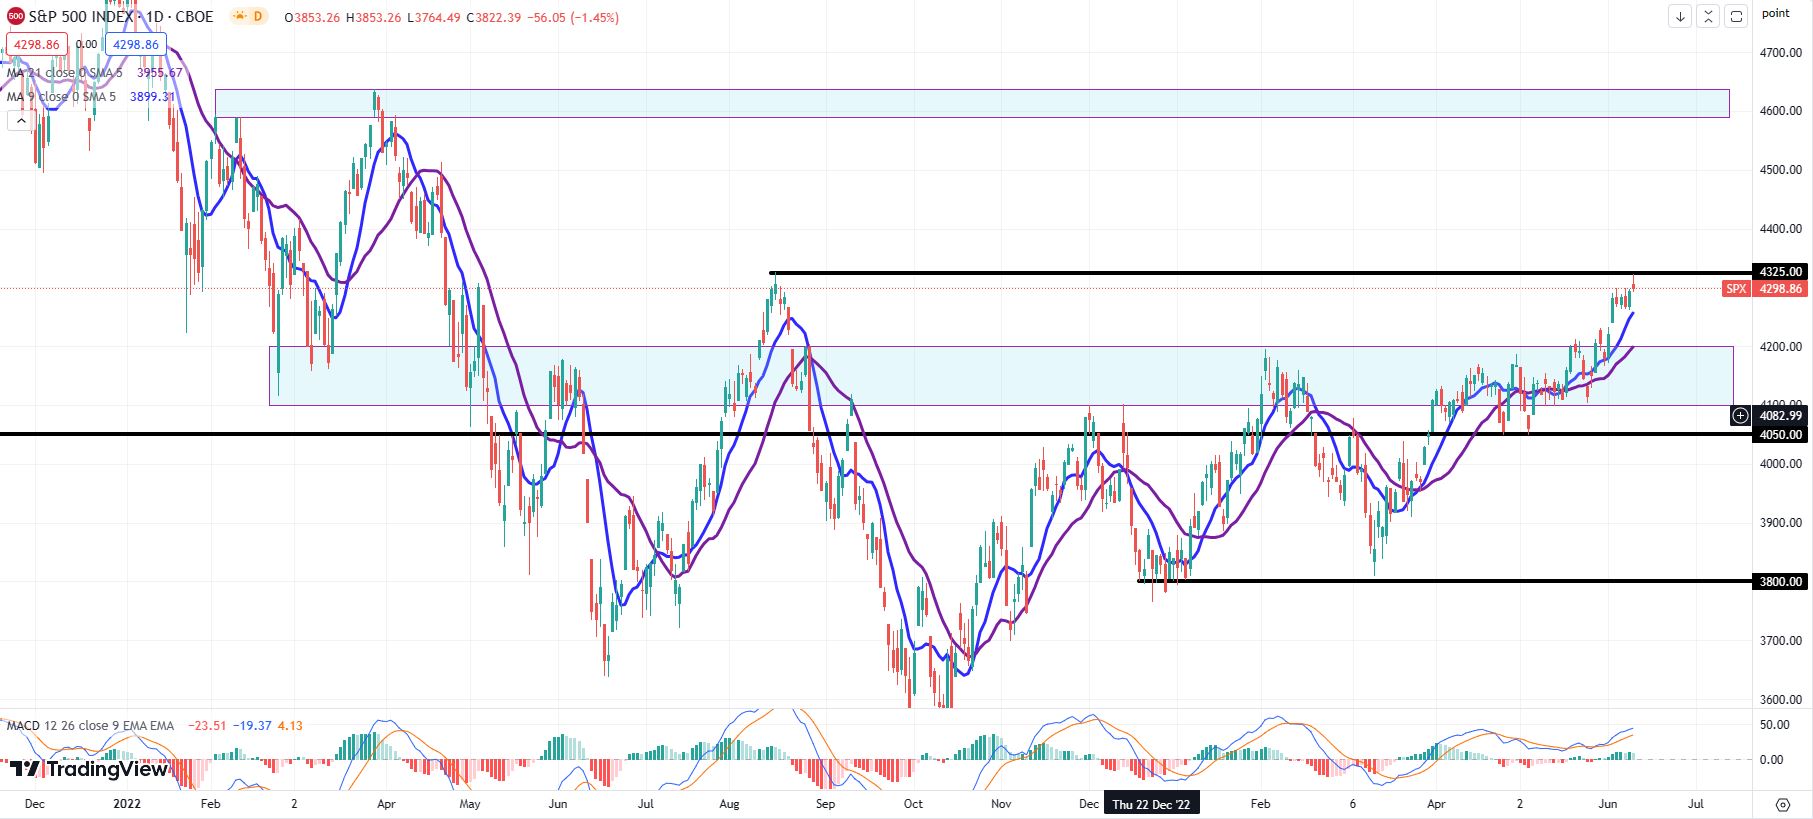
SP 500 daily chart
Author

Clay Webster
FXStreet
Clay Webster grew up in the US outside Buffalo, New York and Lancaster, Pennsylvania. He began investing after college following the 2008 financial crisis.

















