|

S&P 500 ETF (SPY) Elliott Wave: Forecasting the future path

In this technical article, we’re going to take a quick look at the Elliott Wave charts of the SPY ETF , published in the members area of the website. As our members know, SPY remains overall bullish. However, currently it’s correcting the cycle from the August 504.84  low. In this article, we will explain the forecast and the best way to trade SPY.

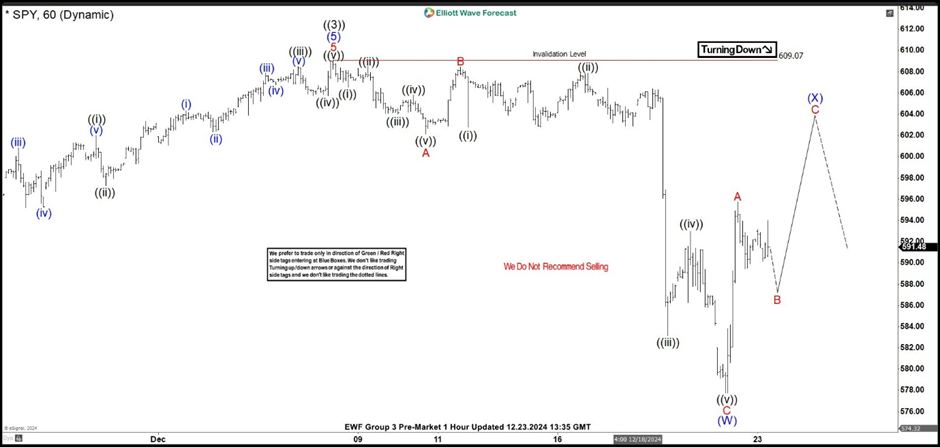
SPY one-hour update 12.23.2024

The ETF is bouncing against the 609.07 high, and currently, the recovery appears incomplete. We’ve seen a sharp rally from the lows, which looks impulsive. The current view suggests the correction can be unfolding as an Elliott Wave Zig Zag pattern while we are still in wave B.

The short-term view suggests we could see another leg down in red wave B before red wave C takes place higher. Anyway, due to the 5 waves from the low, we believe another leg up in red wave C should be seen to complete the blue wave (X) correction against the 609.07 high.

As our members know, we favor the long side in indices and ETFs and do not recommend selling SPY during any proposed pullbacks. If we see the proposed leg down, we will use it as a new buying opportunity.

Chart

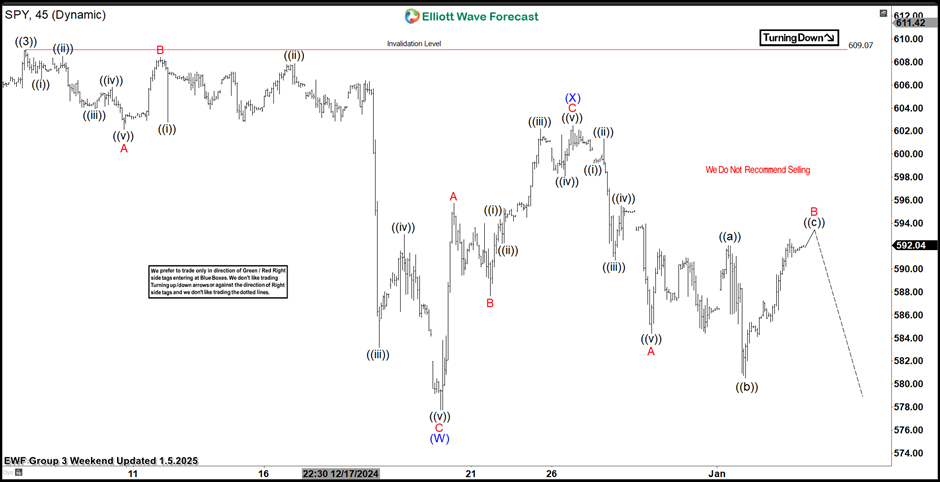
SPY one-hour update 01.05.2024

SPY has traded according to our forecast. We got 3 waves pull back in B red, and then another leg up C red. ETF completed the proposed leg up, forming a Zig Zag pattern against the 609.07 high. We consider the (X) recovery complete at 602.55 level. As long as the price remains below this high, we expect further weakness in the (Y) leg. A break of the (W) blue low is needed to confirm the proposed scenario. We do not recommend selling against the main bullish trend and will view the (Y) leg as a new buying opportunity if the next extreme zone is reached.

Chart

Author

Elliott Wave Forecast Team

Elliott Wave Forecast Team

ElliottWave-Forecast.com

More from Elliott Wave Forecast Team
Share:

Markets move fast. We move first.

Orange Juice Newsletter brings you expert driven insights - not headlines. Every day on your inbox.

By subscribing you agree to our Terms and conditions.

Editor's Picks

EUR/USD extends slide below 1.1700

The EUR/USD pair nears its weekly low at around 1.1660 in the American session on Tuesday, retreating from the 1.1750 price zone tested earlier in the day. Cautiously optimistic markets support the US Dollar in the near term.

GBP/USD retreats from three-month-high, pierces 1.3500

GBP/USD extends its intraday slide and trades in the red just below 1.3500 after setting a new three-month-high near 1.3570. Ahead of this week's key employment data releases from the US, markets recover the good mood.

Gold extends its advance aims to recover hte $4,500 mark

Gold eases from the weekly high it set at $4,475 but clings to modest gains above $4,450 in the second half of the day on Tuesday. While a rebound in the US Dollar caps the yellow metal's upside, heightened political tensions allow XAU/USD to keep its footing.

Crypto Today: Bitcoin, Ethereum, XRP uptrend cools amid surging ETF inflows

Bitcoin is retracing toward support at $93,000 at the time of writing on Tuesday, after reaching a previous day’s high of $94,789. Ethereum and Ripple uptrend has cooled after several days of persistent gains, suggesting potential profit-taking.

Implications of US intervention in Venezuela

Events in Venezuela are top of mind for market participants, and while developments are associated with an elevated degree of uncertainty, we are not making any changes to our markets or economic forecasts as a result of the deposition of Nicolás Maduro. 

Cardano holds steady as bulls intensify push for breakout

Cardano rises above the 50-day EMA resistance amid a risk-on mood across the crypto market. The MACD upholds positive divergence, increasing the potential for a 20% breakout to $0.505.