Southwest Airlines (LUV) testing support: Will the gap fill or will bears break through?

Southwest Airlines (LUV) finds itself at a defining technical level, one that could determine whether we see a meaningful rally or a breakdown that hands control back to sellers.
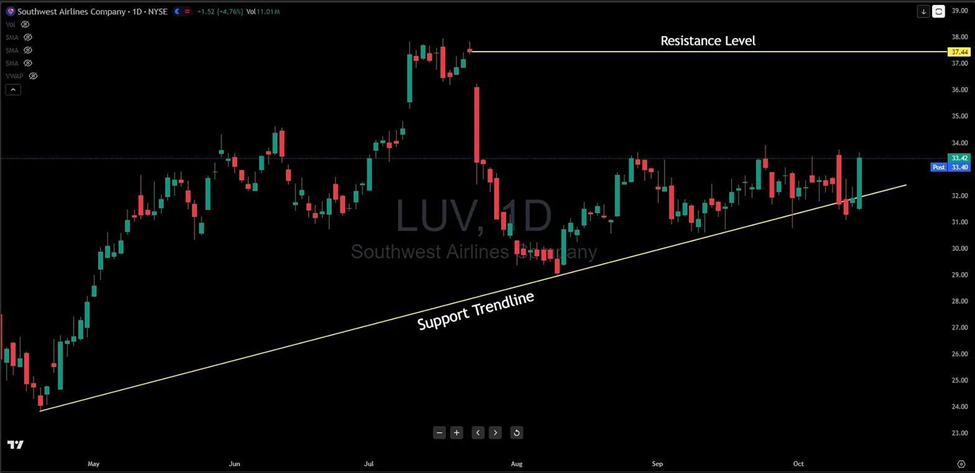
Since late April, this major U.S. carrier has been riding a steady ascending support trendline that's proven remarkably reliable. That golden line has caught price on multiple occasions, each time providing the foundation for another leg higher. The story unfolded beautifully through July, when bulls pushed LUV all the way up to the $37-38 resistance zone before hitting a ceiling they couldn't quite break through.
That rejection in July was swift and decisive—a sharp red candle that sent the stock tumbling and left behind a noticeable gap in the chart. Since then, we've seen three months of choppy, sideways action. But through all that back-and-forth, one element has remained constant: that ascending trendline keeps holding.
Right now, with LUV trading around $33.40, price is testing that support line once again. This is where the story gets compelling. If buyers defend this level and push price back higher, the path of least resistance points straight toward filling that gap—a move that would take us right back to the $37-38 resistance zone. That's roughly a 10-12% potential move from current levels.
What bulls really want to see is more than just a retest of resistance. They're looking for consolidation at or above $37-38, which would signal that sellers have exhausted themselves and buyers are ready to drive this stock into new high territory. That kind of price action would confirm the bulls are firmly in command.
The flip side? If this trendline breaks—and breaks decisively—the technical picture deteriorates quickly. A breakdown below this ascending support would invalidate the entire five-month uptrend structure and hand the reins back to bears, potentially opening the door to much lower prices.
For traders, the setup is straightforward: watch how price behaves at this trendline. A bounce off support with increasing volume could offer an attractive entry for those playing the gap fill. Conservative traders might wait for a break above $34.50-35 to confirm buyers are stepping up. On the short side, a close below the trendline with volume would be the signal bears are looking for.
The risk-reward here favors those with patience. Let the stock tell you which direction it wants to go rather than forcing a trade at this inflection point.
Author

Benjamin Pool
Verified Investing
A seasoned financial expert with a passion for empowering individuals to mastering smart money management.


