SoftBank group corp testing the breakout’s resolve after parabolic surge
SoftBank Group Corp (SFTBF) just delivered one of those chart patterns that makes even experienced analysts do a double-take. After spending years grinding along in relative obscurity, this Japanese tech conglomerate's stock exploded from $18 to nearly $45 in a matter of weeks—then promptly gave back a third of those gains. The question every trader's asking right now: was that spike the beginning of something bigger, or just another false dawn?
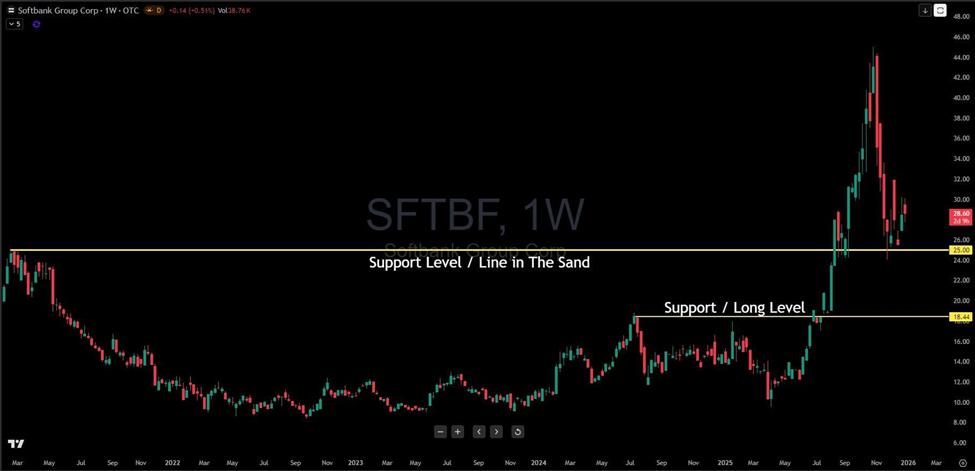
Let's examine what's happening here. For the better part of three years, SFTBF carved out a wide, messy base between $10 and $20. That zone around $18.49 became the floor—a level where buyers consistently stepped in to defend. Think of it as the stock's home base, a place it kept returning to whenever momentum faded.
But then came the breakout. Price didn't just edge above $25; it absolutely shattered through that level like it was made of paper. That $25 mark—what I'm calling the "line in the sand"—represented years of overhead resistance. Once cleared, the floodgates opened. We saw a near-vertical climb that peaked just shy of $45, a move that likely caught shorts completely off guard and pulled in momentum chasers.
After that parabolic run, SFTBF has now retraced back to test the very level it broke out from. The stock is currently trading around $28-29, hovering just above that former resistance zone at $25. This is textbook technical action. Former resistance often becomes new support once cleared. The real test is whether buyers show up here with conviction.
For bulls, the setup is straightforward: if SFTBF holds above $25 on this pullback, it confirms the breakout as legitimate and sets up another leg higher. A bounce from here could target a retest of the recent highs near $45, or even push beyond if momentum returns. Traders watching for long entries might look for stabilization around current levels or wait for a stronger bounce off the $25 zone with confirming volume.
The bearish case hinges entirely on that $25 level failing. If price slices back below and closes beneath it on heavy volume, the breakout is compromised. That would likely trigger another wave of selling back toward the $18 support zone, effectively erasing months of progress in a matter of days.
We also have to consider the timeframe we're looking at. This is a weekly chart, meaning each candle represents an entire week of trading. Moves on this scale don't reverse on a whim. The recent pullback could simply be profit-taking after an overextended rally, or it could be early signs that the breakout lacked the fundamental backing to sustain itself.
Volume would be the missing piece of this puzzle. If the selloff occurred on lighter volume while the initial breakout had heavy participation, that favors the bulls. Conversely, if we're seeing distribution (heavy selling volume) at these levels, it's a red flag.
The risk management here is crystal clear: longs need to protect themselves with stops below $24. A close beneath $25 invalidates the support thesis and opens the door for deeper losses. Shorts, on the other hand, shouldn't get too comfortable. Any sign of strength above $30 could trigger another squeeze higher.
What strikes me most about this chart is the violence of the initial move. Stocks that go parabolic rarely do so without reason—whether it's a major catalyst, sector rotation, or institutional accumulation. SoftBank's portfolio includes stakes in ARM Holdings, Alibaba, and numerous AI-related ventures, sectors that have seen explosive interest recently. That context matters.
The next few weeks will tell us everything. Either SFTBF finds its footing here and continues building on the breakout, or it collapses back into the range and forces traders to reassess. For anyone watching this name, the $25 level is your North Star. Respect it, and you'll know exactly where you stand.
Author

Benjamin Pool
Verified Investing
A seasoned financial expert with a passion for empowering individuals to mastering smart money management.


