|

Silver Price Forecast: XAG/USD rises after weak US Manufacturing PMI

  • XAG/USD stands with nearly 0.50% gains near $22.90 after reaching a daily high of $23.70.
  • US Manufacturing PMI fell to 46 in June, a contraction worse than expected.
  • Falling US Treasury yields gave room for the precious metal to rise.

Silver prices (XAG/USD) are rising, showing gains of approximately 0.70% and trading near $22.90, following a surge that led to a daily high of $23.70. This upward momentum comes in response to the weak US Manufacturing Purchasing Managers' Index (PMI) for June, which recorded a contractionary figure of 46, falling short of expectations. The decline in US Treasury yields has allowed the precious metal to advance, although it is worth noting that yields are still in positive territory, which can limit the XAG/USD’s upside potential.

US reported weak Manufacturing PMI; yields hold their ground

The most recent release of the Institute for Supply Management's (ISM) Manufacturing Purchasing Managers Index (PMI) for June revealed a reading of 46, falling short of the expected 47.2 and the previous figure of 46.9.

Despite a broad retreat in US yields (which could be seen as the opportunity cost of holding Silver), the Federal Reserve's (Fed) hawkish expectations for July have remained firm. The CME FedWatch Tool indicates that a 25 basis points (bps) hike in the upcoming July 31 meeting is practically priced in, while the likelihood of another 25 bps hike in 2023 has increased to around 40%. Furthermore, market participants eagerly await the release of Non-Farm Payroll (NFP) data on Friday, as it will continue shaping expectations regarding the Fed's future decisions.

That being said, it's worth noticing that higher interest rates tend to weaken precious metal prices, so traders should be aware that a hot NFP reading may trigger further downside for the XAG/USD.

XAG/USD Levels to watch

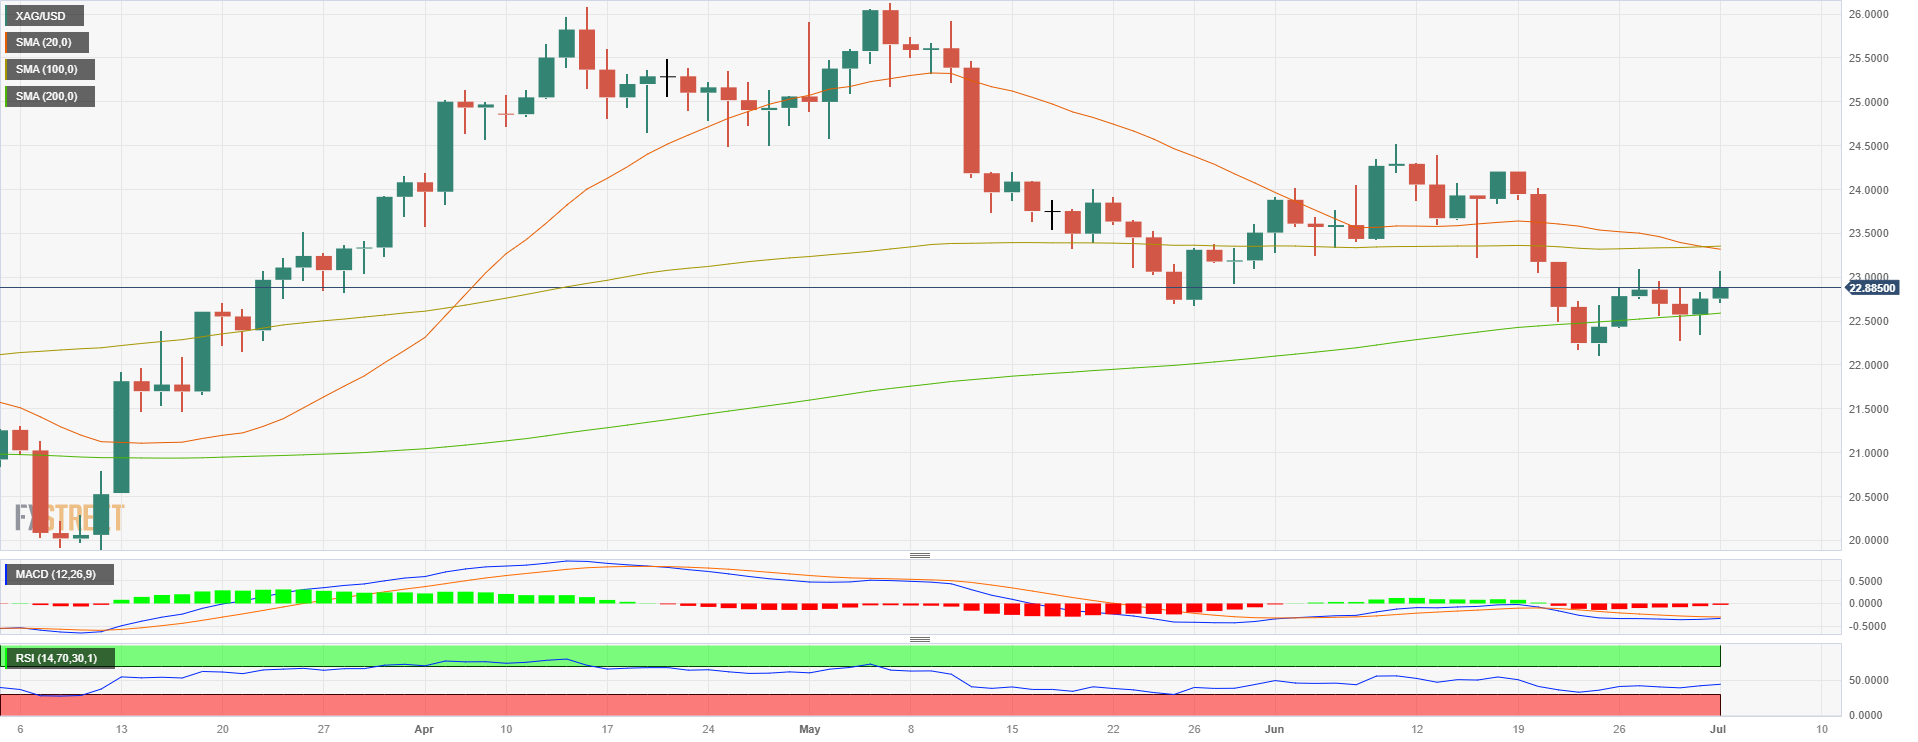
According to the daily chart, the technical outlook for the XAG/USD remains neutral with a bearish bias. The 20 and 100-day Simple Moving Averages (SMAs) are about to perform a bearish cross while indicators remain in negative territory.

If the metal continues to gain ground, resistance levels to consider are seen at the daily high of around $23.05, followed by $23.10 and the mentioned bearish cross at $23.30. Conversely, support levels are seen at the $22.80 level and below at the 200-day SMA at $23.55 and the $23.55 area.

XAG/USD Daily chart

XAG/USD

Overview
Today last price22.89
Today Daily Change0.13
Today Daily Change %0.57
Today daily open22.76
 
Trends
Daily SMA2023.35
Daily SMA5023.94
Daily SMA10023.35
Daily SMA20022.57
 
Levels
Previous Daily High22.84
Previous Daily Low22.35
Previous Weekly High23.1
Previous Weekly Low22.28
Previous Monthly High24.53
Previous Monthly Low22.11
Daily Fibonacci 38.2%22.65
Daily Fibonacci 61.8%22.54
Daily Pivot Point S122.46
Daily Pivot Point S222.15
Daily Pivot Point S321.96
Daily Pivot Point R122.95
Daily Pivot Point R223.14
Daily Pivot Point R323.45

Author

Patricio Martín

Patricio is an economist from Argentina passionate about global finance and understanding the daily movements of the markets.

More from Patricio Martín
Share:

Markets move fast. We move first.

Orange Juice Newsletter brings you expert driven insights - not headlines. Every day on your inbox.

By subscribing you agree to our Terms and conditions.

Editor's Picks

EUR/USD struggles to extend advance above 1.1800

The EUR/USD pair posts a fresh weekly low near 1.1740 during the Asian trading session on Wednesday. The major currency pair is under pressure as the US Dollar edges higher despite Federal Open Market Committee minutes of the December policy meeting, released on Tuesday, showing that most policymakers stressed the need for further interest rate cuts.

GBP/USD trades flat above 1.3450 amid thin trading volume

The GBP/USD pair holds steady around 1.3465 during the early Asian trading hours on Wednesday. However, the Bank of England guided that monetary policy will remain on a gradual downward path, which might underpin the Cable against the US Dollar. Financial markets are expected to trade on thin volumes as traders prepare for the New Year holiday.

Gold attempts another run toward $4,400 on final day of 2025

Gold price makes another attempt toward $4,400 in Asian trading on Tuesday, keeping the recovery mode intact following Monday's over 4% correction. The bright metal seems to cheer upbeat Chinese NBS and RatingDog Manufacturing and Services PMI data for December. 

Top Crypto Gainers: Canton, Four, Plasma rally secures double-digit gains

Canton, Four, and Plasma are the top-performing crypto assets over the last 24 hours with double-digit gains. The extended recovery in Canton is gaining traction while Four and Plasma target a decisive close above the 200-period Exponential Moving Average on the 4-hour chart.

Economic outlook 2026-2027 in advanced countries: Solidity test

After a year marked by global economic resilience and ending on a note of optimism, 2026 looks promising and could be a year of solid economic performance. In our baseline scenario, we expect most of the supportive factors at work in 2025 to continue to play a role in 2026.

Crypto market outlook for 2026

Year 2025 was volatile, as crypto often is.  Among positive catalysts were favourable regulatory changes in the U.S., rise of Digital Asset Treasuries (DAT), adoption of AI and tokenization of Real-World-Assets (RWA).