Silver Price Forecast: XAG/USD rebounds to near $61.00 as US Dollar comes under pressure
- Silver price recovers to near $61.00 as the US Dollar retreats.
- BBH sees the US Dollar outperforming as strong US business data supports hawkish Fed bets.
- Investors keenly await FOMC minutes of the September policy meeting.

Silver price (XAG/USD) holds its recovery move seen in the early European trade from $60.30 to near $61.00 ahead of the opening of United States (US) markets on Tuesday. The white metal bounces back as the US Dollar Index (DXY) retreats after hitting a fresh annual high near 102.54 on Monday to near 101.95, at press time.
Technically, some correction in the US Dollar (USD) offers relief to the Silver price.
However, market experts see the US Dollar outperforming amid the US economic resilience.
Strategists at Brown Brothers Harriman (BBH) argue that the latest US business surveys continue to underpin the Federal Reserve’s (Fed) hawkish stance and the Dollar. They note that the "US September ISM indexes back the Fed’s tightening bias and is USD supportive," with the headline services and manufacturing readings "point[ing] to resilient growth" while the "Prices Paid indexes signal inflation pressures are intensifying."
In the BBH view, this backdrop is reflected in market pricing, as "Fed funds futures continue to price in a full 25bps hike to 4.00-4.25% in December."
For fresh cues regarding the US interest rate outlook, investors await Federal Open Market Committee (FOMC) minutes of the September policy meeting, which will be released on Wednesday. In the policy meeting, the Fed hiked policy rates by 25 basis points (bps) to the 3.75%-4.00% and signaled at least one more this year.
Silver Technical Analysis
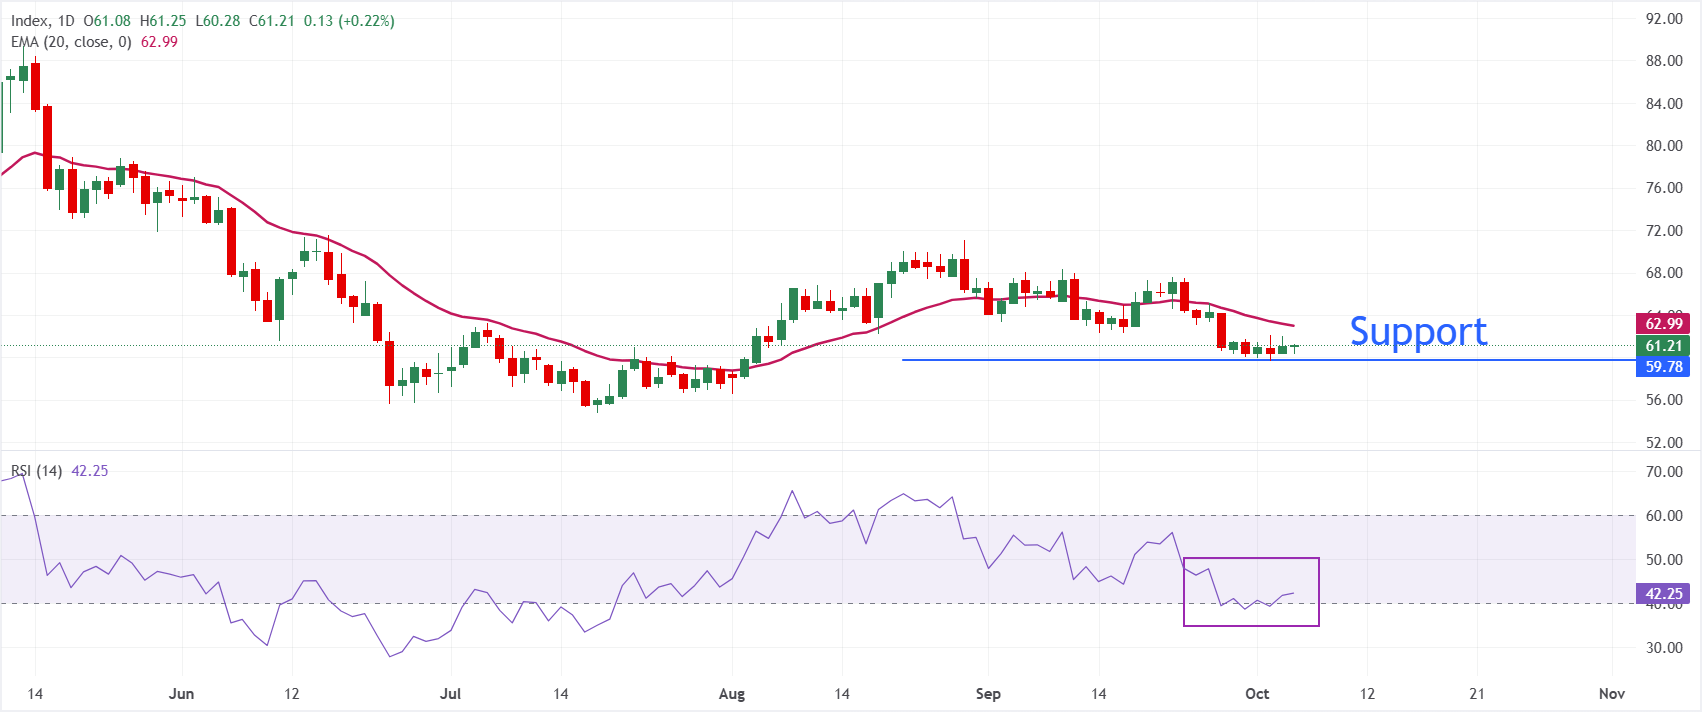
In the daily chart, XAG/USD trades at $61.21, holding a bearish near-term bias as it remains below the 20-day exponential moving average (EMA) at $62.99. The pair has retreated from recent highs and is now capped by this short-term trend indicator, while the Relative Strength Index (RSI) at 42.27 stays in a subdued, mildly bearish territory that hints at persistent downside pressure rather than outright oversold conditions.
On the topside, immediate resistance is located at the 20-day EMA at $62.99, and a sustained break above this barrier would be needed to ease the current bearish tone and open the way for a more constructive recovery. On the downside, momentum conditions reflected by the RSI suggest sellers retain control, leaving XAG/USD vulnerable to further slippage as long as price trades beneath the $62.99 cap.
(The technical analysis of this story was written with the help of an AI tool. Know more.)
Silver FAQs
Silver is a precious metal highly traded among investors. It has been historically used as a store of value and a medium of exchange. Although less popular than Gold, traders may turn to Silver to diversify their investment portfolio, for its intrinsic value or as a potential hedge during high-inflation periods. Investors can buy physical Silver, in coins or in bars, or trade it through vehicles such as Exchange Traded Funds, which track its price on international markets.
Silver prices can move due to a wide range of factors. Geopolitical instability or fears of a deep recession can make Silver price escalate due to its safe-haven status, although to a lesser extent than Gold's. As a yieldless asset, Silver tends to rise with lower interest rates. Its moves also depend on how the US Dollar (USD) behaves as the asset is priced in dollars (XAG/USD). A strong Dollar tends to keep the price of Silver at bay, whereas a weaker Dollar is likely to propel prices up. Other factors such as investment demand, mining supply – Silver is much more abundant than Gold – and recycling rates can also affect prices.
Silver is widely used in industry, particularly in sectors such as electronics or solar energy, as it has one of the highest electric conductivity of all metals – more than Copper and Gold. A surge in demand can increase prices, while a decline tends to lower them. Dynamics in the US, Chinese and Indian economies can also contribute to price swings: for the US and particularly China, their big industrial sectors use Silver in various processes; in India, consumers’ demand for the precious metal for jewellery also plays a key role in setting prices.
Silver prices tend to follow Gold's moves. When Gold prices rise, Silver typically follows suit, as their status as safe-haven assets is similar. The Gold/Silver ratio, which shows the number of ounces of Silver needed to equal the value of one ounce of Gold, may help to determine the relative valuation between both metals. Some investors may consider a high ratio as an indicator that Silver is undervalued, or Gold is overvalued. On the contrary, a low ratio might suggest that Gold is undervalued relative to Silver.
Author
Sagar Dua
FXStreet
Sagar Dua is associated with the financial markets from his college days. Along with pursuing post-graduation in Commerce in 2014, he started his markets training with chart analysis.

















