Silver Price Forecast: XAG/USD jumps to record high past $89.00 as bullish momentum fades
- Silver hits a record $89.11 before pulling back, still posting solid gains on the session.
- RSI divergence hints at waning momentum, though the broader uptrend structure remains intact.
- Resistance sits at $87.00 and $88.00, while $86.23- and $85.50-mark key supports.
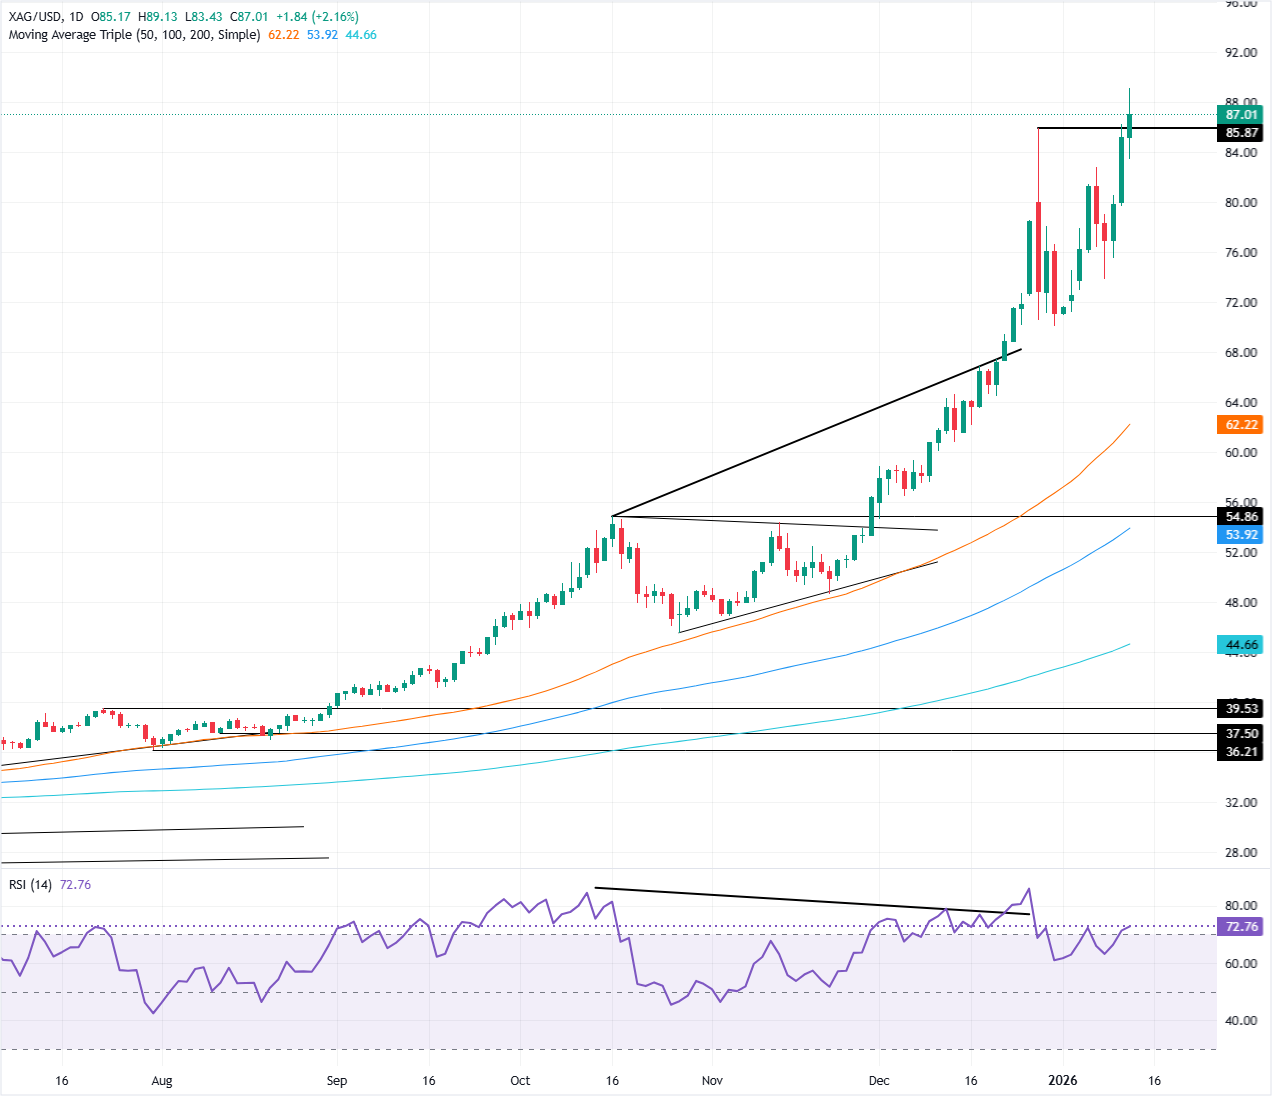
Silver price (XAG/USD) registers gain of 2% on Tuesday after reaching an all time high of 89.11 as the Greenback recovers amid a soft inflation report in the United States. At the time of writing, XAG/USD trades at $86.91 after bouncing off daily lows of $83.45.
XAG/USD Price Forecast: Technical outlook
Silver’s uptrend remains intact as buyers pushed the grey metal to record high near the $90.00 figure. Although price action reached successive series of higher highs and higher lows, it seems that the move is overextended.
There are signs of divergence between price action and the Relative Strength Index (RSI), which hints that buyers are losing momentum.
Despite this, the path of least resistance is tilted upwards. XAG/USD first resistance will be the $87.00 figure followed by the $88.00 mark and the all-timer high at $89.11.
On the flip side, XAG/USD first support would be the January 12 high at $86.23, followed by the $85.50 area. A breach of the latter will expose the $80.00 a troy ounce barrier.
XAG/USD Price Chart – Daily
Silver FAQs
Silver is a precious metal highly traded among investors. It has been historically used as a store of value and a medium of exchange. Although less popular than Gold, traders may turn to Silver to diversify their investment portfolio, for its intrinsic value or as a potential hedge during high-inflation periods. Investors can buy physical Silver, in coins or in bars, or trade it through vehicles such as Exchange Traded Funds, which track its price on international markets.
Silver prices can move due to a wide range of factors. Geopolitical instability or fears of a deep recession can make Silver price escalate due to its safe-haven status, although to a lesser extent than Gold's. As a yieldless asset, Silver tends to rise with lower interest rates. Its moves also depend on how the US Dollar (USD) behaves as the asset is priced in dollars (XAG/USD). A strong Dollar tends to keep the price of Silver at bay, whereas a weaker Dollar is likely to propel prices up. Other factors such as investment demand, mining supply – Silver is much more abundant than Gold – and recycling rates can also affect prices.
Silver is widely used in industry, particularly in sectors such as electronics or solar energy, as it has one of the highest electric conductivity of all metals – more than Copper and Gold. A surge in demand can increase prices, while a decline tends to lower them. Dynamics in the US, Chinese and Indian economies can also contribute to price swings: for the US and particularly China, their big industrial sectors use Silver in various processes; in India, consumers’ demand for the precious metal for jewellery also plays a key role in setting prices.
Silver prices tend to follow Gold's moves. When Gold prices rise, Silver typically follows suit, as their status as safe-haven assets is similar. The Gold/Silver ratio, which shows the number of ounces of Silver needed to equal the value of one ounce of Gold, may help to determine the relative valuation between both metals. Some investors may consider a high ratio as an indicator that Silver is undervalued, or Gold is overvalued. On the contrary, a low ratio might suggest that Gold is undervalued relative to Silver.
Author

Christian Borjon Valencia
FXStreet
Markets analyst, news editor, and trading instructor with over 14 years of experience across FX, commodities, US equity indices, and global macro markets.


