Silver Price Forecast: XAG/USD consolidates around $33.00; seems poised to climb further
- Silver struggles to capitalize on the previous day’s strong move up.
- A breakout through a short-term descending channel favors bulls.
- Dips could be seen as a buying opportunity near the $32.65 area.

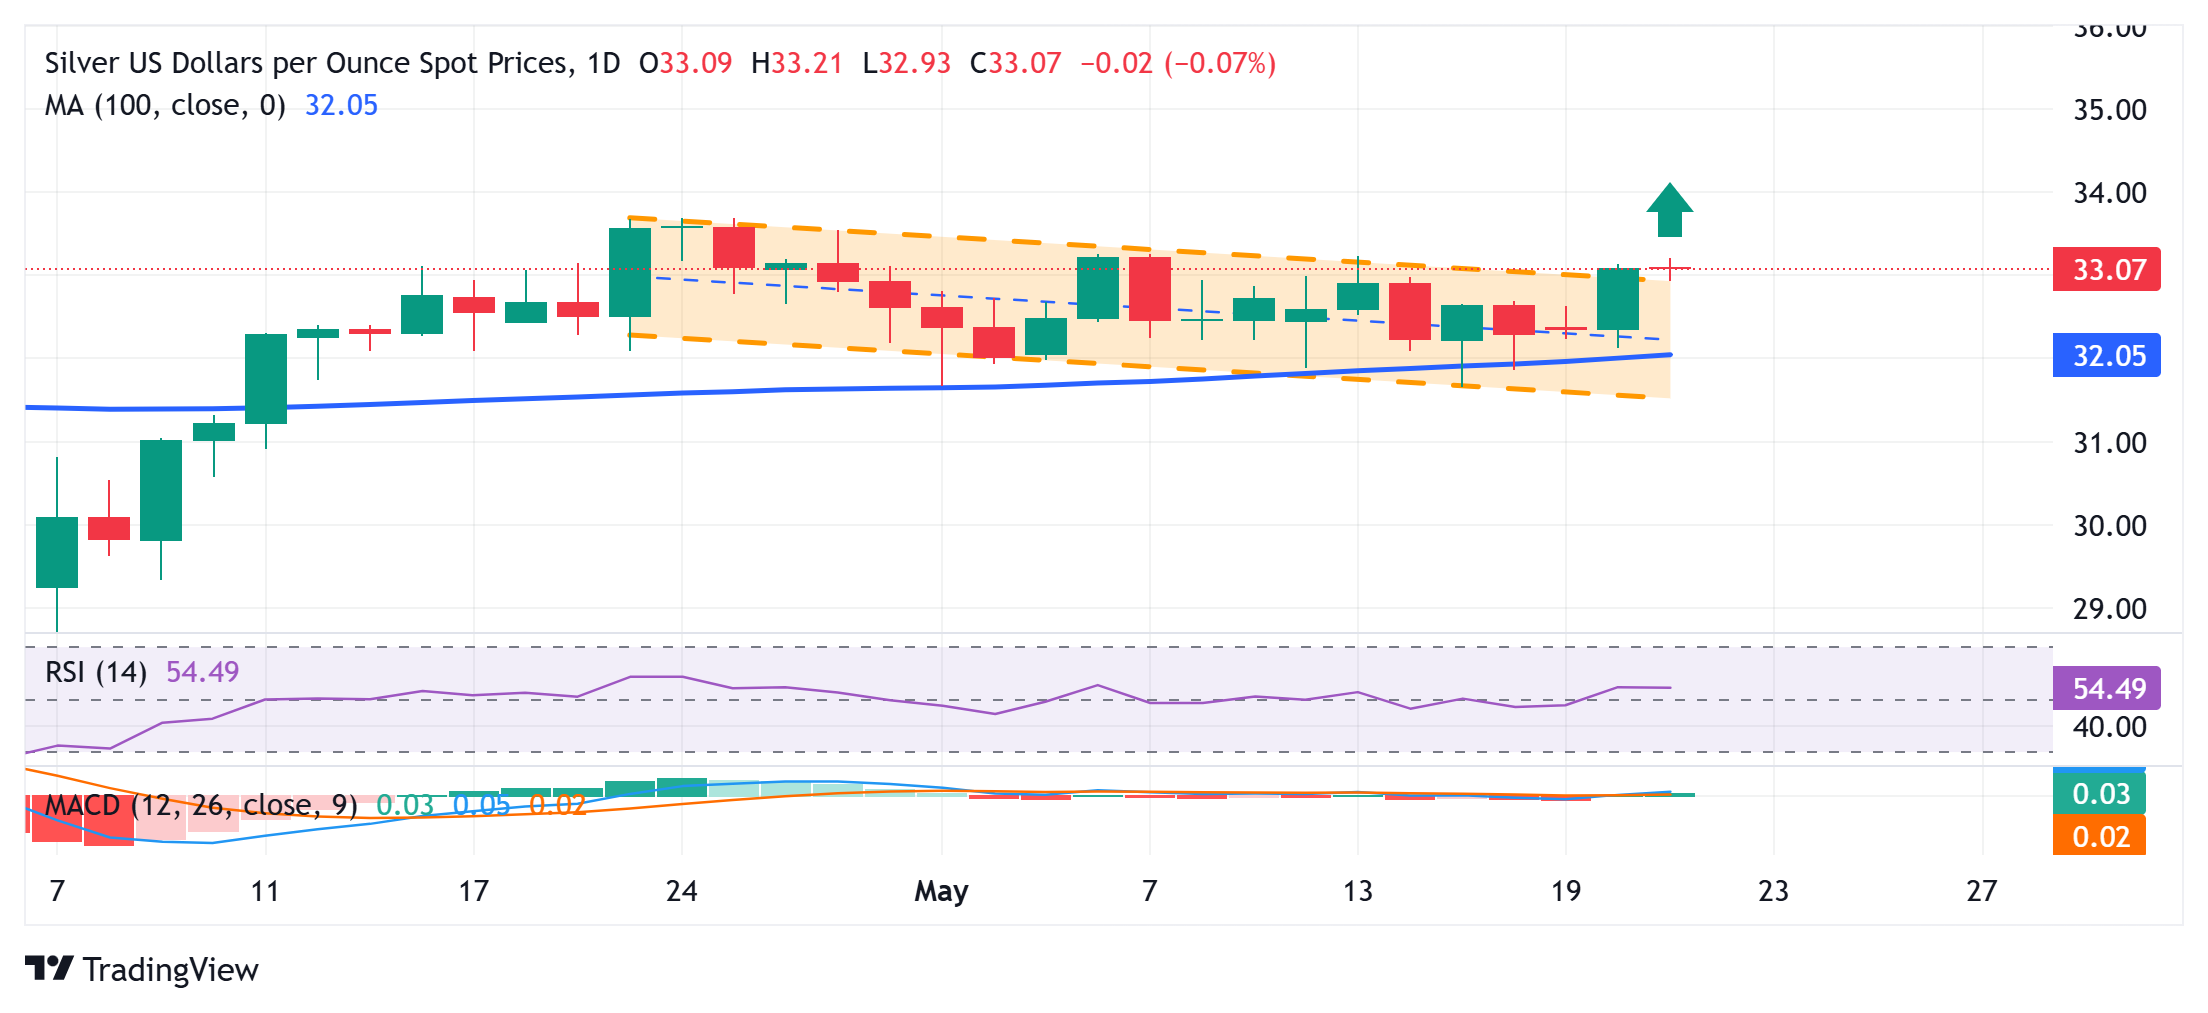
Silver (XAG/USD) retreats slightly following an Asian session uptick to the $33.20 area, or over a one-week high, and erodes a part of the previous day's strong move up. The white metal currently trades around the $33.00 mark, down 0.30% for the day, though the technical setup favors bullish traders.
Tuesday's close above the $33.00 mark confirmed a breakout through the top boundary of a multi-week-old descending channel, which constituted the formation of a bullish flag pattern. This comes on top of the recent repeated bounce from the 100-day Simple Moving average (SMA) and validates the constructive setup. Moreover, oscillators on the daily chart have just started moving in positive territory and suggest that the path of least resistance for the XAG/USD is to the upside.
Hence, any subsequent slide might be seen as a buying opportunity and remain limited near the $32.65 horizontal zone. Some follow-through selling, however, would expose the 100-day SMA, currently pegged just above the $32.00 round-figure mark. The subsequent fall could drag the XAG/USD to the descending channel support, around the $31.40 area. A convincing break below the latter will negate the positive outlook and shift the bias in favor of bearish traders.
On the flip side, momentum beyond the Asian session peak, around the $33.20 area, could face some resistance near the $33.60 region, above which the XAG/USD could aim to reclaim the $34.00 round figure mark. The momentum could extend further and eventually lift the white metal to the year-to-date high, around the $34.55-$34.60 zone touched in March.
Silver daily chart
Silver FAQs
Silver is a precious metal highly traded among investors. It has been historically used as a store of value and a medium of exchange. Although less popular than Gold, traders may turn to Silver to diversify their investment portfolio, for its intrinsic value or as a potential hedge during high-inflation periods. Investors can buy physical Silver, in coins or in bars, or trade it through vehicles such as Exchange Traded Funds, which track its price on international markets.
Silver prices can move due to a wide range of factors. Geopolitical instability or fears of a deep recession can make Silver price escalate due to its safe-haven status, although to a lesser extent than Gold's. As a yieldless asset, Silver tends to rise with lower interest rates. Its moves also depend on how the US Dollar (USD) behaves as the asset is priced in dollars (XAG/USD). A strong Dollar tends to keep the price of Silver at bay, whereas a weaker Dollar is likely to propel prices up. Other factors such as investment demand, mining supply – Silver is much more abundant than Gold – and recycling rates can also affect prices.
Silver is widely used in industry, particularly in sectors such as electronics or solar energy, as it has one of the highest electric conductivity of all metals – more than Copper and Gold. A surge in demand can increase prices, while a decline tends to lower them. Dynamics in the US, Chinese and Indian economies can also contribute to price swings: for the US and particularly China, their big industrial sectors use Silver in various processes; in India, consumers’ demand for the precious metal for jewellery also plays a key role in setting prices.
Silver prices tend to follow Gold's moves. When Gold prices rise, Silver typically follows suit, as their status as safe-haven assets is similar. The Gold/Silver ratio, which shows the number of ounces of Silver needed to equal the value of one ounce of Gold, may help to determine the relative valuation between both metals. Some investors may consider a high ratio as an indicator that Silver is undervalued, or Gold is overvalued. On the contrary, a low ratio might suggest that Gold is undervalued relative to Silver.
Author

Haresh Menghani
FXStreet
Haresh Menghani is a detail-oriented professional with 10+ years of extensive experience in analysing the global financial markets.


