Silver Price Forecast: XAG/USD bull’s eye $25.00 as Ukraine/Russia war extends – War update
- Ukraine – Russia war continuation increased appetite for precious metals, like silver and gold.
- The financial market mood is depressed, as safe-have assets remain buoyant.
- XAG/USD Technical Outlook: Neutral biased, but a break above $25.00 could lead to $26.00.

Silver (XAG/USD) climbs in the North American session, as XAG/USD tests the January 20 daily high at $24.70 amid a risk-off market mood. XAG/USD is trading at $24.94 at the time of writing.
On Tuesday, the market sentiment is risk-off as portrayed by Europan cash indices in the red, while US equity futures point to a lower open. In the FX complex, commodity-linked currencies rise while safe-haven peers remain buoyant. US Treasuries are down, as portrayed by the US 10-year note at 1.77%, six basis points lower than Monday’s close, while the US Dollar Index advances firmly above the 97 mark.
Ukraine – Russia Update
Geopolitical news, linked to the ongoing war in Eastern Europe, keep grabbing all the attention. Ukraine President Zelensky reported that peace talks did not achieve the required results, while Russia said it is too early to assess the effects of discussions at the moment. The peace talks appear to be stuck, though they could be buying time for Russia, as a convoy of Russian armour – initially reported at 17 miles long but later stretched to 40 miles – has been seen snaking its way to Kyiv. Furthermore, Russian Defense Minister Shoygu said that Russia would continue operations until it achieves its goals. It is worth noting that the Ukrainian parliament reported the presence of Belarus troops entering through Chernihiv.
At 15:00 GMT, the US economic docket will feature the Institute for Supply Management (ISM) Manufacturing PMI for February, expected at 58, alongside Employment, New Orders, and Prices, which could give some clues in the state of the US economy. Even though market analysts have priced in a 25 basis points (bps) increase to the Federal Fund Rates (FFR), some officials would like a 50 bps hike.
XAG/USD Price Forecast: Technical outlook
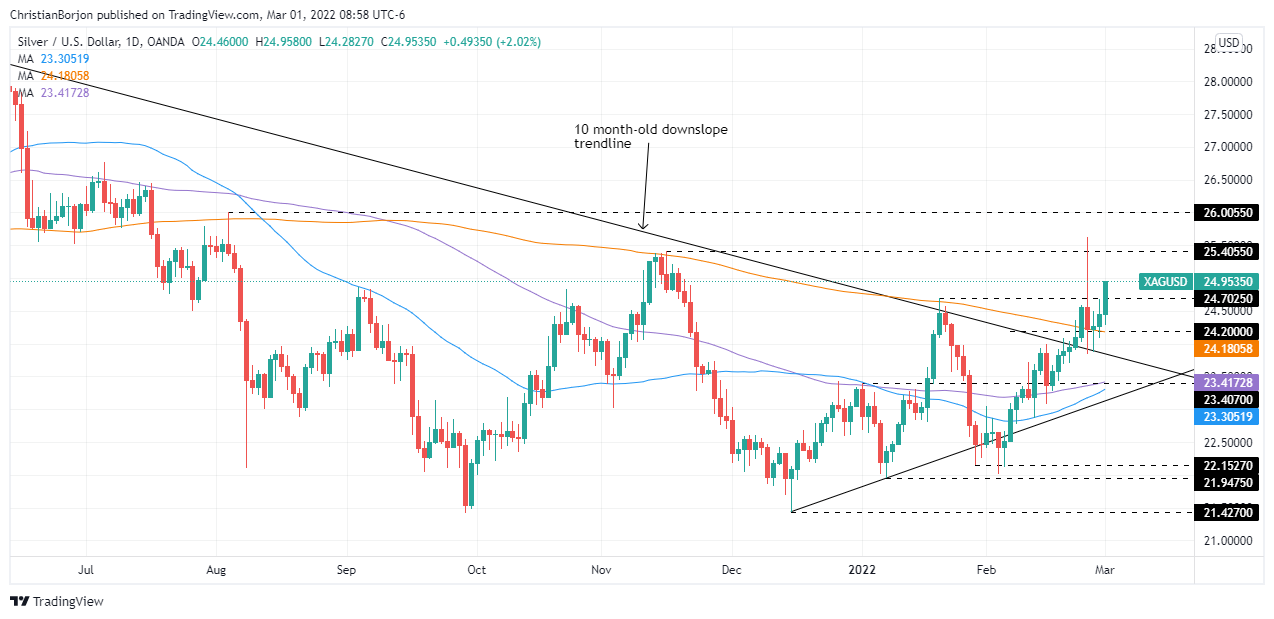
Silver (XAG/USD) began the week on the right foot, gapping up from Friday’s close at $24.18 up to Monday’s daily high at $24.63, then retracing to the confluence of the 200-day moving average (DMA) and the daily pivot point at $24.12, before rising and aiming to break Monday’s daily high. Even though all DMAs reside below the spot price, it does not guarantee an upward bias because they are in disorder (with the 200-DMA above the 100 and the 50-DMA, respectively). That said, the non-yielding metal is technically neutral but could become neutral-upwards if the 50-DMA breaks above the 100-DMA.
XAG/USD’s first line of resistance would be the psychological $25.00 barrier, followed by the February 25 YTD high at $25.60, and August 4, 2021, high at $26.00. Contrarily, on the downside, XAG/USD’s first support would be January 20 swing high at $24.68. Breach of the latter would expose the 200-DMA at $24.18 and the $24.00 mark.
Author

Christian Borjon Valencia
FXStreet
Markets analyst, news editor, and trading instructor with over 14 years of experience across FX, commodities, US equity indices, and global macro markets.


