|

Silver Price Analysis: XAG/USD surges amidst high US bond yields, strong USD

  • Silver is still bullish but could test a four-month-old resistance-turned-support trendline nearby $24.20-40.
  • XAG/USD Price Analysis: It’s upward biased, though downside risks remain below $25.00.

Silver price erased its earlier losses that dragged the white metal towards testing February 2 highs at $24.63 per ounce and rallied back above the $25.00 psychological figure. Although the US Dollar (USD) remained underpinned by high US Treasury bond yields, the XAG/USD is trading at $25.25, about to finish Wednesday’s session with gains of 0.28%.

XAG/USD Price Action

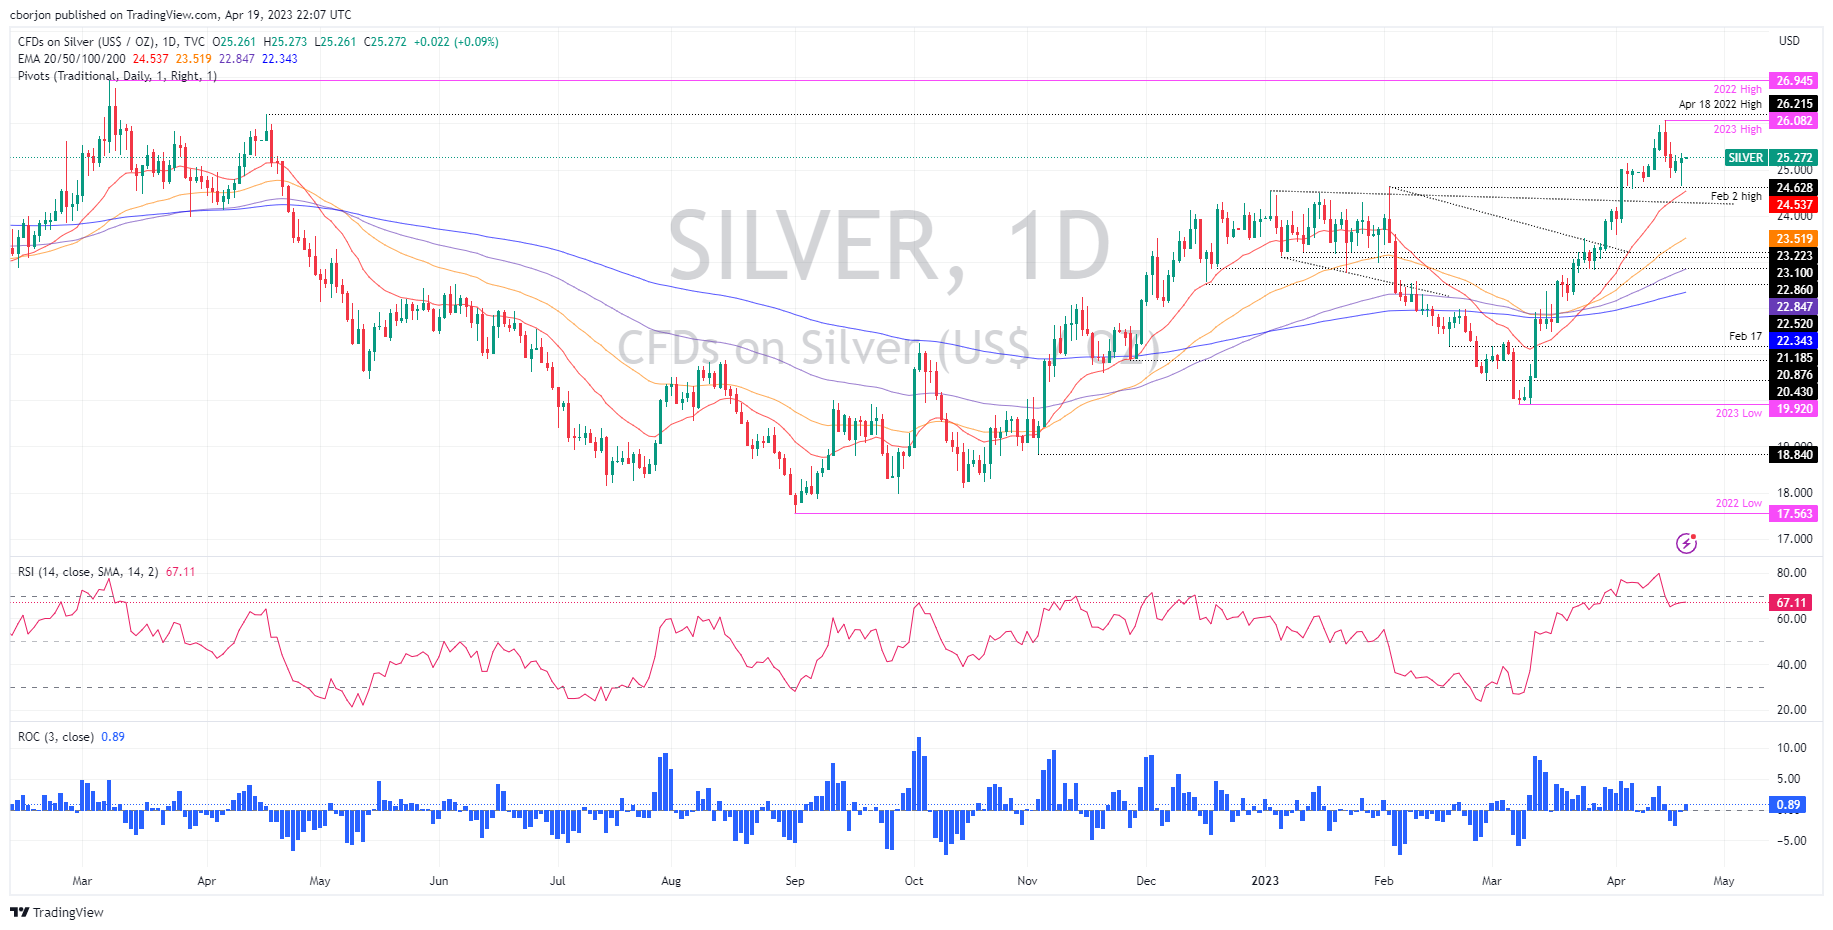
Since hitting YTD high at 26.08, the XAG/USD dropped sharply due to the overbought Relative Strength Index (RSI). Therefore, traders moved quickly to book profits, weakening Silver, which tumbled more than 5%. However, as oscillators turned neutral, the XAG/USD bottomed around $24.61, some 20-pips above the 20-day EMA.

For a bullish continuation, the XAG/USD must crack Wednesday’s high at $25.36. Once cleared, the XAG/USD next stop will be the April 17 daily high at $25.60 before posing a threat to $26.00, ahead of the YTD high at $26.08.

Conversely, the XAG/USD first support would be the psychological $25.00 level. A breakout to the downside will expose the 20-day EMA At $24.46, followed by a previously broken resistance-turned-support level at $24.20, as sellers brace towards $24,00. Once cleared, sellers will eye a test of the 50-day EMA at $23.45.

XAG/USD Daily Chart

XAG/USD Daily Chart

XAG/USD

Overview
Today last price25.29
Today Daily Change0.09
Today Daily Change %0.36
Today daily open25.2
 
Trends
Daily SMA2024.26
Daily SMA5022.57
Daily SMA10023.01
Daily SMA20021.32
 
Levels
Previous Daily High25.32
Previous Daily Low24.93
Previous Weekly High26.09
Previous Weekly Low24.72
Previous Monthly High24.16
Previous Monthly Low19.9
Daily Fibonacci 38.2%25.17
Daily Fibonacci 61.8%25.08
Daily Pivot Point S124.98
Daily Pivot Point S224.76
Daily Pivot Point S324.59
Daily Pivot Point R125.37
Daily Pivot Point R225.54
Daily Pivot Point R325.76

Author

Christian Borjon Valencia

Markets analyst, news editor, and trading instructor with over 14 years of experience across FX, commodities, US equity indices, and global macro markets.

More from Christian Borjon Valencia
Share:

Editor's Picks

EUR/USD stays well offered below 1.1800

The selling pressure on EUR/USD is picking up pace, with the pair slipping decisively below the key 1.1800 level and sliding to fresh two week lows as Wednesday’s session draws to a close. The move lower comes as the US Dollar finds renewed strength after the latest round of US data and the release of the FOMC Minutes. Next of note on the docket will be the US weekly Initial Jobless Claims.
 

GBP/USD reaches multi-day lows near 1.3500

GBP/USD reverses its initial upside momentum and is now adding to previous declines, approaching the 1.3500 region on Wednesday. Cable’s downtick comes on the back of decent gains in the Greenback and easing UK inflation figures, which seem to have reinforced the case for a BoE rate cut in March.

Gold battle to regain $5,000 continues

Gold is back on the front foot on Wednesday, shaking off part of the early week softness and challenging two-day highs near the $5,000 mark per troy ounce. The move comes ahead of the FOMC Minutes and is unfolding despite an intense rebound in the US Dollar.

Bitcoin has found or is near a bottom, extended consolidation to follow: K33

Bitcoin (BTC) is nearing or has already established a bottom, which could be followed by a sustained period of slow price movement, according to K33.

Mixed UK inflation data no gamechanger for the Bank of England

Food inflation plunged in January, but service sector price pressure is proving stickier. We continue to expect Bank of England rate cuts in March and June. The latest UK inflation read is a mixed bag for the Bank of England, but we doubt it drastically changes the odds of a March rate cut.

Sui extends sideways action ahead of Grayscale’s GSUI ETF launch

Sui is extending its downtrend for the second consecutive day, trading at 0.95 at the time of writing on Wednesday. The Layer-1 token is down over 16% in February and approximately 34% from the start of the year, aligning with the overall bearish sentiment across the crypto market.