|

Silver Price Analysis: XAG/USD sticks to strong gains above $23.00, eyes 100-day SMA

  • Silver gains strong positive traction on Thursday and climbs back closer to the 100-day SMA barrier.
  • The technical setup favours bullish traders and supports prospects for a further appreciating move.
  • A sustained move and acceptance below $22.00 is needed to negate the near-term positive bias.

Silver (XAG/USD) builds on the overnight bounce from the 200-hour Simple Moving Average (SMA) support near the $22.75 area, or the weekly low and gains strong positive traction on Thursday. The momentum remains unabated through the first half of the European session and lifts the white metal to the $23.10-$23.15 region.

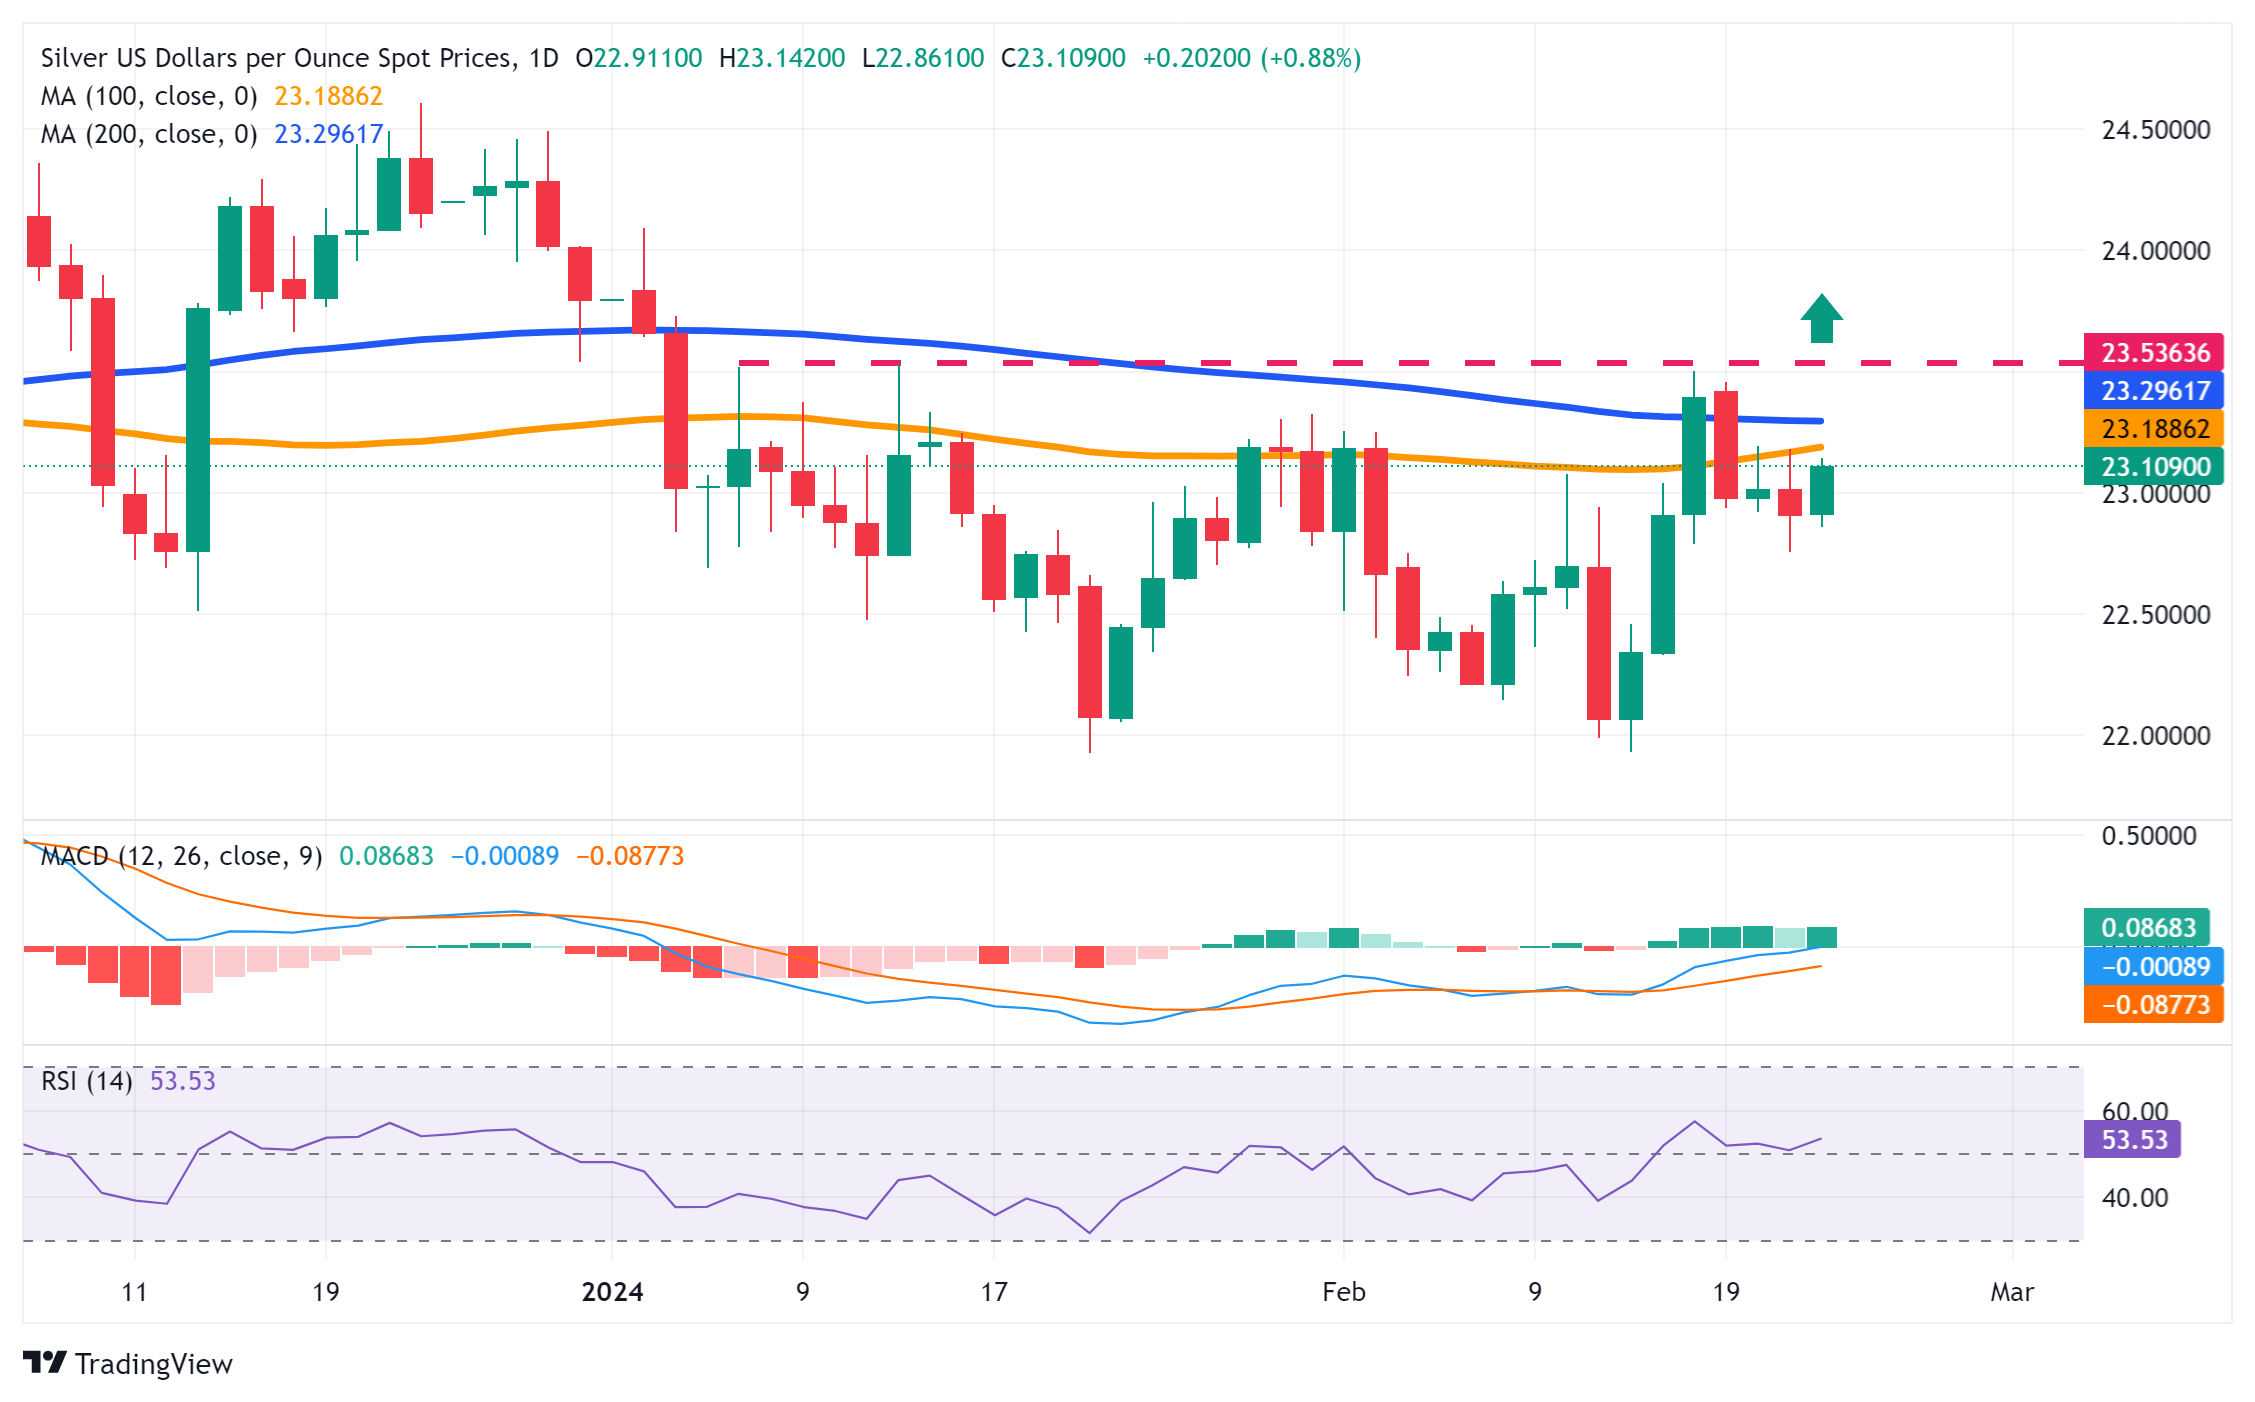
From a technical perspective, the XAG/USD is currently placed just below the 100-day SMA, which is closely followed by the very important 200-day SMA hurdle near the $23.30-$23.35 zone and the monthly peak, around mid-$23.00 touched last week. A sustained strength beyond the latter will be seen as a fresh trigger for bullish traders and pave the way for the resumption of last week's strong move up from sub-$22.00 levels.

Given that oscillators on the daily chart have just started gaining positive traction, the XAG/USD might then aim to reclaim the $24.00 round figure. The momentum could extend further and allow the white metal to climb towards the next relevant hurdle near the $24.50-$24.60 region en route to the $25.00 psychological mark.

On the flip side, the overnight swing low, around the $22.75 region, now seems to protect the immediate downside ahead of the mid-$22.00s and the $22.30 horizontal support. Some follow-through selling might expose the $22.00 mark. Acceptance below a two-month low, around the $21.90-$21.85 zone touched in January, will be seen as a fresh trigger for bearish traders and make the XAG/USD vulnerable to test the $21.40-$21.35 support.

The subsequent decline has the potential to drag the XAG/USD further below the $21.00 round-figure mark, towards retesting the October monthly swing low near the $20.70-$20.65 region.

Silver daily chart

fxsoriginal

Technical levels to watch

XAG/USD

Overview
Today last price23.13
Today Daily Change0.22
Today Daily Change %0.96
Today daily open22.91
 
Trends
Daily SMA2022.76
Daily SMA5023.14
Daily SMA10023.17
Daily SMA20023.3
 
Levels
Previous Daily High23.18
Previous Daily Low22.76
Previous Weekly High23.5
Previous Weekly Low21.93
Previous Monthly High24.09
Previous Monthly Low21.93
Daily Fibonacci 38.2%22.92
Daily Fibonacci 61.8%23.02
Daily Pivot Point S122.71
Daily Pivot Point S222.52
Daily Pivot Point S322.29
Daily Pivot Point R123.14
Daily Pivot Point R223.37
Daily Pivot Point R323.57

Author

Haresh Menghani

Haresh Menghani is a detail-oriented professional with 10+ years of extensive experience in analysing the global financial markets.

More from Haresh Menghani
Share:

Markets move fast. We move first.

Orange Juice Newsletter brings you expert driven insights - not headlines. Every day on your inbox.

By subscribing you agree to our Terms and conditions.

Editor's Picks

EUR/USD runs past 1.1730 after tepid US macroeconomic figures

EUR/USD extends its gains and trades above 1.1730 in the American session on Thursday. The US Dollar resumed its decline, following much weaker-than-expected Initial Jobless Claims. Market players bet for additional rate cuts despite a mildly hawkish Fed.

GBP/USD ticks north beyond 1.3400 after US employment data

GBP/USD ticks beyond 1.3400 in the American session on Thursday, as the US Dollar is back on the losing side, following worse-than-anticipated US employment-related figures. The US Federal Reserve delivered a rate cut at its December meeting, in line with the market’s expectations.

Gold on its way to retest record highs

Broad US Dollar weakness helps the bright metal to extend weekly gains. The XAU/USD pair trades above $4,250, its highest for the week and not far from its record high in the $4,380 region. The Greenback came under selling pressure on Wednesday following the Federal Reserve's monetary policy announcement, further pressured on Thursday by softer-than-anticipated United States employment data. 

Solana dips as hawkish Fed cuts dampen market sentiment

Solana price is trading below $130 on Thursday, after being rejected at the upper boundary of its falling wedge pattern. The broader market weakness following the Federal Reserve’s hawkish rate cut has added to downside momentum.

FOMC Summary: A split cut and a clear shift toward caution

The Federal Reserve (Fed) went ahead with a 25 basis points rate cut, taking the target range to 3.50–3.75%. But the tone around the decision mattered just as much as the move.

Solana dips as hawkish Fed cuts dampen market sentiment
Solana (SOL) price is trading below $130 at the time of writing on Thursday, after being rejected at the upper boundary of its falling wedge pattern. The broader market weakness following the Federal Reserve’s hawkish rate cut has added to downside momentum.