Silver Price Analysis: XAG/USD stands neutral following ISM PMIs, labor data looms


  • Recent ISM report signaled an uptick in US business activity, with PMIs beating expectations.
  • Markets are discounting a reduced likelihood of a rate cut at the Fed's June meeting.
  • Perceived hawkish bets on the Fed fueled a surge in US Treasury bond yields which weigh on non-yielding metals.
  • Investors await key US labor market indicators to gain further guidance on the economy's health.

The XAG/USD pair is trading near the $24.98 level, mostly neutral during Monday's session. This comes after the signals of resilience in the US economy underscored by the recent Institute for Supply Management (ISM) report and the surprising uptick in the Manufacturing Purchasing Managers' Index (PMI). In that sense, the resilience of the US economy fueled a rise in hawkish bets on the Federal Reserve (Fed) in hand with higher US Treasury yields which made the grey metal decline.

The recent figures from the Institute for Supply Management (ISM) report have brought a breath of fresh air to perceptions of the US economy, revealing an uptick in business activity for March. This comes as a signal of economic robustness, a sentiment echoed by the Manufacturing Purchasing Managers' Index (PMI) which climbed to 50.3 in March. This figure not only surpassed the forecasted 48.4 but marked a noticeable advance from February's 47.8. Meanwhile, the ISM report's Prices Paid Index leaped to an annual high of 55.8, a level not seen since it stood at 52.5 in August 2022.

This pattern of improvement might lead the Federal Reserve (Fed) to think twice about easing its monetary policy. Market reactions were swift, with the likelihood of a rate cut at the Fed's June meeting plummeting from 85% to around 65% in response to the enduring resilience of the US economy. The bond market has also felt the ripples of these developments, with a notable surge in US Treasury bond yields, often seen as the cost of holding non-yielding metals, with the 2-year yield rising to 4.71%, while both the 5-year and the 10-year yields are at 4.33%, all pointing to a sharp uptick and possibly reflecting increased hawkish bets on the Fed. 

Looking ahead, key US labor market indicators such as Nonfarm Payrolls, Average Hourly Earnings, and the Unemployment Rate are highly anticipated. These figures are poised to provide deeper insights into the current health and trajectory of the country's workforce, offering critical clues to both policymakers and investors.

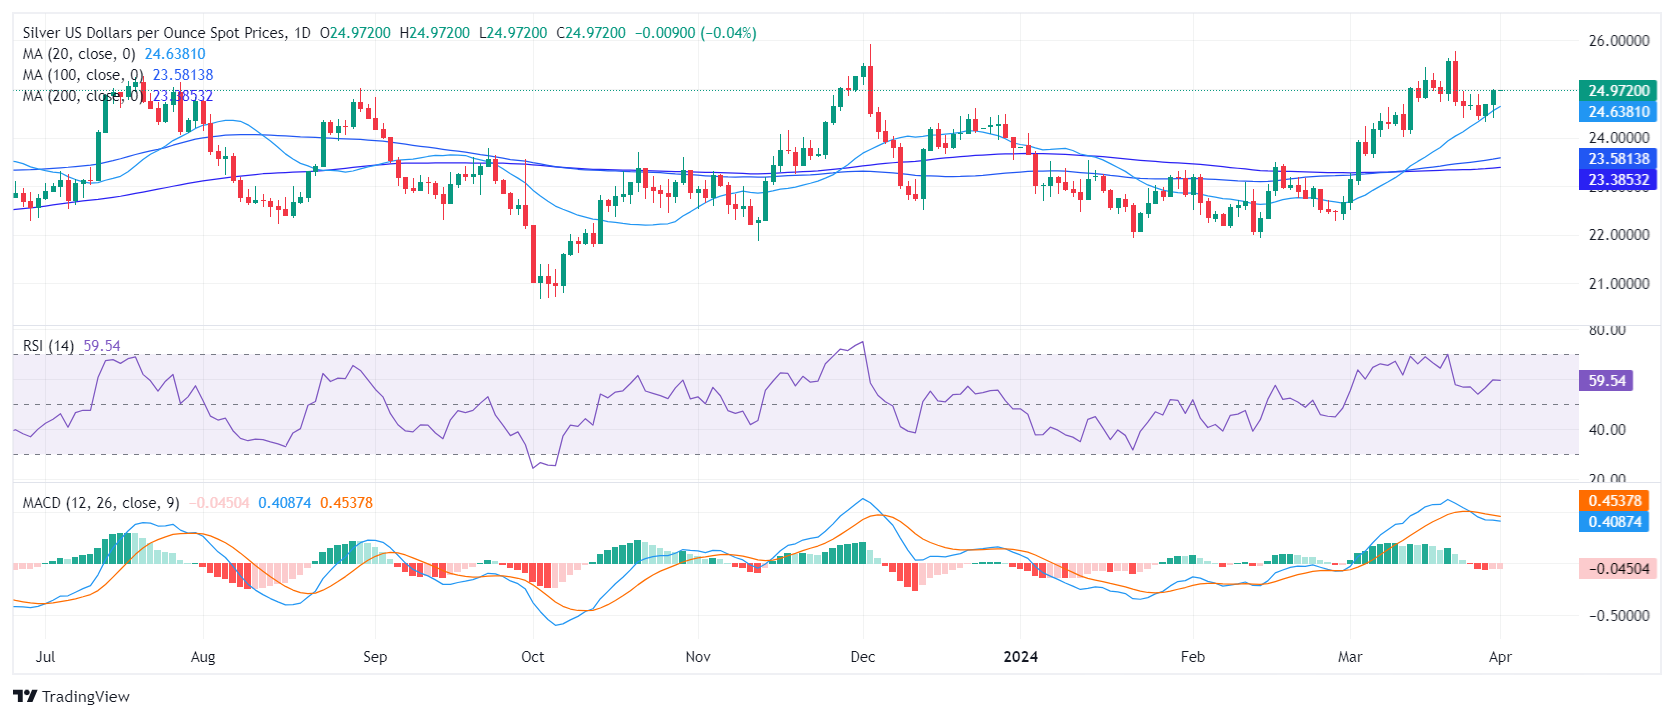
XAG/USD technical analysis

On the daily chart, the Relative Strength Index (RSI) reveals a positive trend for the XAG/USD. The RSI reading, nestled in the positive territory, remains steady affirming the dominance of buyers, which may lead to continued upward momentum. However, the Moving Average Convergence Divergence (MACD) stands in negative territory, printing red bars which suggests that there is a mild bearish presence.

When scrutinizing the overall trend, the XAG/USD currently sits above the 20-day, 100-day, and 200-day Simple Moving Averages (SMA), denoting strong upward momentum over the larger time frames.

XAG/USD

Overview
Today last price 24.99
Today Daily Change 0.01
Today Daily Change % 0.04
Today daily open 24.98
 
Trends
Daily SMA20 24.55
Daily SMA50 23.44
Daily SMA100 23.55
Daily SMA200 23.37
 
Levels
Previous Daily High 25
Previous Daily Low 24.39
Previous Weekly High 25
Previous Weekly Low 24.33
Previous Monthly High 25.77
Previous Monthly Low 22.51
Daily Fibonacci 38.2% 24.77
Daily Fibonacci 61.8% 24.63
Daily Pivot Point S1 24.58
Daily Pivot Point S2 24.18
Daily Pivot Point S3 23.97
Daily Pivot Point R1 25.19
Daily Pivot Point R2 25.4
Daily Pivot Point R3 25.8


Share: Feed news

Information on these pages contains forward-looking statements that involve risks and uncertainties. Markets and instruments profiled on this page are for informational purposes only and should not in any way come across as a recommendation to buy or sell in these assets. You should do your own thorough research before making any investment decisions. FXStreet does not in any way guarantee that this information is free from mistakes, errors, or material misstatements. It also does not guarantee that this information is of a timely nature. Investing in Open Markets involves a great deal of risk, including the loss of all or a portion of your investment, as well as emotional distress. All risks, losses and costs associated with investing, including total loss of principal, are your responsibility. The views and opinions expressed in this article are those of the authors and do not necessarily reflect the official policy or position of FXStreet nor its advertisers. The author will not be held responsible for information that is found at the end of links posted on this page.

If not otherwise explicitly mentioned in the body of the article, at the time of writing, the author has no position in any stock mentioned in this article and no business relationship with any company mentioned. The author has not received compensation for writing this article, other than from FXStreet.

FXStreet and the author do not provide personalized recommendations. The author makes no representations as to the accuracy, completeness, or suitability of this information. FXStreet and the author will not be liable for any errors, omissions or any losses, injuries or damages arising from this information and its display or use. Errors and omissions excepted.

The author and FXStreet are not registered investment advisors and nothing in this article is intended to be investment advice.

Recommended content


Recommended content

Editors’ Picks

AUD/USD retargets the 0.6600 barrier and above

AUD/USD retargets the 0.6600 barrier and above

AUD/USD extended its positive streak for the sixth session in a row at the beginning of the week, managing to retest the transitory 100-day SMA near 0.6580 on the back of the solid performance of the commodity complex.

AUD/USD News

EUR/USD keeps the bullish bias above 1.0700

EUR/USD keeps the bullish bias above 1.0700

EUR/USD rapidly set aside Friday’s decline and regained strong upside traction in response to the marked retracement in the Greenback following the still-unconfirmed FX intervention by the Japanese MoF.

EUR/USD News

Gold advances for a third consecutive day

Gold advances for a third consecutive day

Gold fluctuates in a relatively tight channel above $2,330 on Monday. The benchmark 10-year US Treasury bond yield corrects lower and helps XAU/USD limit its losses ahead of this week's key Fed policy meeting.

Gold News

Bitcoin price dips to $62K range despite growing international BTC validation via spot ETFs

Bitcoin price dips to $62K range despite growing international BTC validation via spot ETFs

Bitcoin (BTC) price closed down for four weeks in a row, based on the weekly chart, and could be on track for another red candle this week. The last time it did this was in the middle of the bear market when it fell by 42% within a span of nine weeks. 

Read more

Japan intervention: Will it work?

Japan intervention: Will it work?

Dear Japan Intervenes in the Yen for the first time since November 2022 Will it work? Have we seen a top in USDJPY? Let's go through the charts.

Read more

Forex MAJORS

Cryptocurrencies

Signatures