|

Silver Price Analysis: XAG/USD slides to mid-$24.00s, 100-day SMA holds the key for bulls

  • Silver meets with a fresh supply on Tuesday and stalls a two-day-old recovery from the 100-DMA.
  • The setup seems tilted in favour of bulls and supports prospects for the emergence of dip-buying.
  • A convincing break below $24.00 will negate the positive bias and pave the way for deeper losses.

Silver comes under some renewed selling pressure on Tuesday and extends its steady intraday descent through the early part of the European session. The white metal currently trades around the $23.55 area, down nearly 1% for the day, and for now, seems to have stalled a two-day-old recovery trend from the $24.00 mark, or a two-week low touched last Thursday.

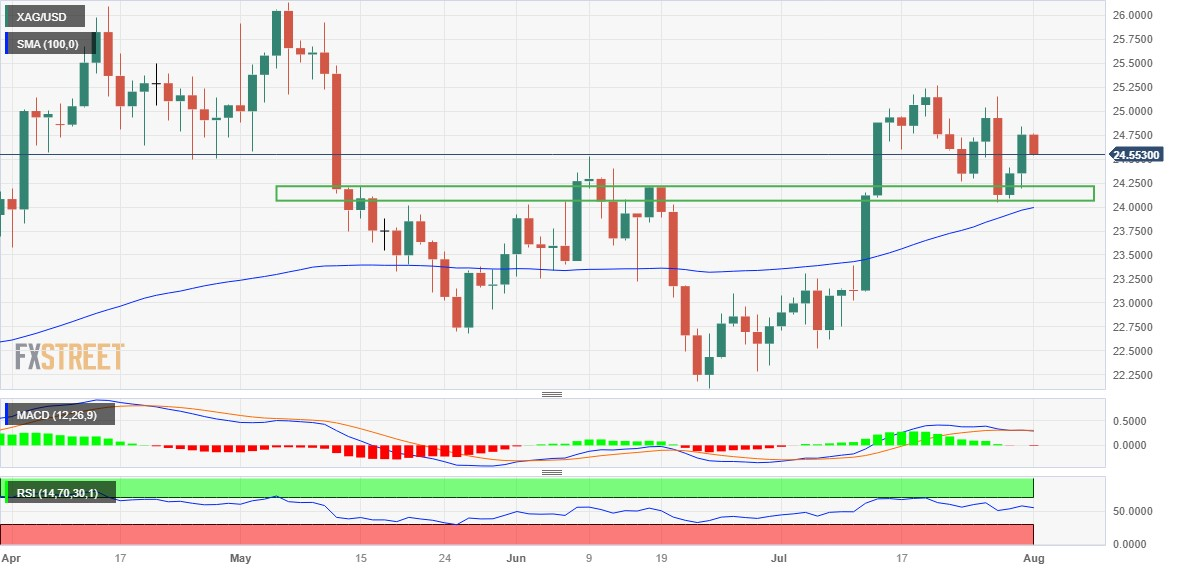
The aforementioned handle coincides with a technically significant 100-day Simple Moving Average (SMA) and should continue to protect the immediate downside. A convincing break below will be seen as a fresh trigger for bearish traders and set the stage for deeper losses. The XAG/USD might then turn vulnerable and accelerate the downfall towards testing the next relevant support near the $23.20-$23.15 area.

This is closely followed by the very important 200-day SMA support near the $23.00 mark. Some follow-through selling will make the XAG/USD vulnerable to accelerate the fall towards challenging the multi-month low, around the $22.15-$22.10 area touched in June.

That said, technical indicators on the daily chart - though have been losing traction - as still holding in the positive territory. This, in turn, favours bullish traders and supports prospects for the emergence of some dip-buying at lower levels. However, it will still be prudent to wait for a sustained strength beyond the daily top, around the $24.75 region, before positioning for a move towards the $25.00 psychological mark.

The next relevant hurdle is pegged near the monthly peak, around the $25.25 zone, which if cleared will negate any negative outlook. Silver might then aim to surpass the $25.50-$25.55 intermediate hurdle and reclaim the $26.00 mark before climbing further to the YTD peak, around the $26.10-$26.15 area touched in May.

Silver daily chart

fxsoriginal

Key levels to watch

XAG/USD

Overview
Today last price24.56
Today Daily Change-0.20
Today Daily Change %-0.81
Today daily open24.76
 
Trends
Daily SMA2024.19
Daily SMA5023.67
Daily SMA10023.97
Daily SMA20023.08
 
Levels
Previous Daily High24.84
Previous Daily Low24.2
Previous Weekly High25.15
Previous Weekly Low24.04
Previous Monthly High25.27
Previous Monthly Low22.52
Daily Fibonacci 38.2%24.59
Daily Fibonacci 61.8%24.44
Daily Pivot Point S124.35
Daily Pivot Point S223.96
Daily Pivot Point S323.71
Daily Pivot Point R125
Daily Pivot Point R225.24
Daily Pivot Point R325.64

Author

Haresh Menghani

Haresh Menghani is a detail-oriented professional with 10+ years of extensive experience in analysing the global financial markets.

More from Haresh Menghani
Share:

Editor's Picks

EUR/USD: Gains remain capped by 1.1650

EUR/USD remains in recovery-mode following the closing bell in Euroland on Wednesday, hovering around the 1.1650 zone amid renewed downside pressure on the US Dollar and a marginal improvement in the global sentiment.

GBP/USD appears bid around 1.3370

GBP/USD reverses part of its recent multi-day decline, gathering some balance and managing to reach the 1.3400 region, where some initial resistance seems to have turned up. Cable’s uptick comes in response to some loss of momentum in the Greenback despite the geopolitical scenario remaining fragile.

Gold recovers modestly despite intensifying Middle East crisis

Gold keeps its daily gains well in place, although a break above the $5,200 mark per troy ounce still remains elusive on Wednesday. The yellow metal’s rebound comes in response to the persistent flight-to-safety amid intense geopolitical tensions in the Middle East and the bearish performance of the US Dollar.

Crypto Today: Bitcoin, Ethereum, XRP rebound amid mixed ETF flows

The cryptocurrency market is showing subtle recovery signs despite heightened global uncertainty following the United States (US) and Israel attacks on Iran and the subsequent retaliations that have morphed into a wider Middle East war.

First Venezuela, now Iran: The US-China energy war escalates

At first glance, the latest escalation involving the United States with both Iran and Venezuela looks like another chapter in a long-running geopolitical story. But viewed through a broader strategic lens, something else may be unfolding: Energy.

Bittensor extends recovery despite retail demand slump

Bittensor, a leading Artificial Intelligence token, is aging up above $190 at the time of writing on Wednesday. Steady price increases characterise the broader crypto market, with Bitcoin holding above $71,000 and Ethereum above $2,000.