Silver Price Analysis: XAG/USD seems poised to retest multi-month high, north of $24.00


  • Silver catches fresh bids on Tuesday and rallies to the $24.00 neighbourhood.
  • The technical setup favours bulls and supports prospects for additional gains.
  • A break below the $22.80 confluence is needed to negate the positive outlook.

Silver gains strong positive traction on Tuesday and rallies to a fresh daily high, back closer to the $24.00 mark in the last hour. The white metal, however, trims a part of its intraday gains and retreats to the mid-$23.00s heading into the North American session.

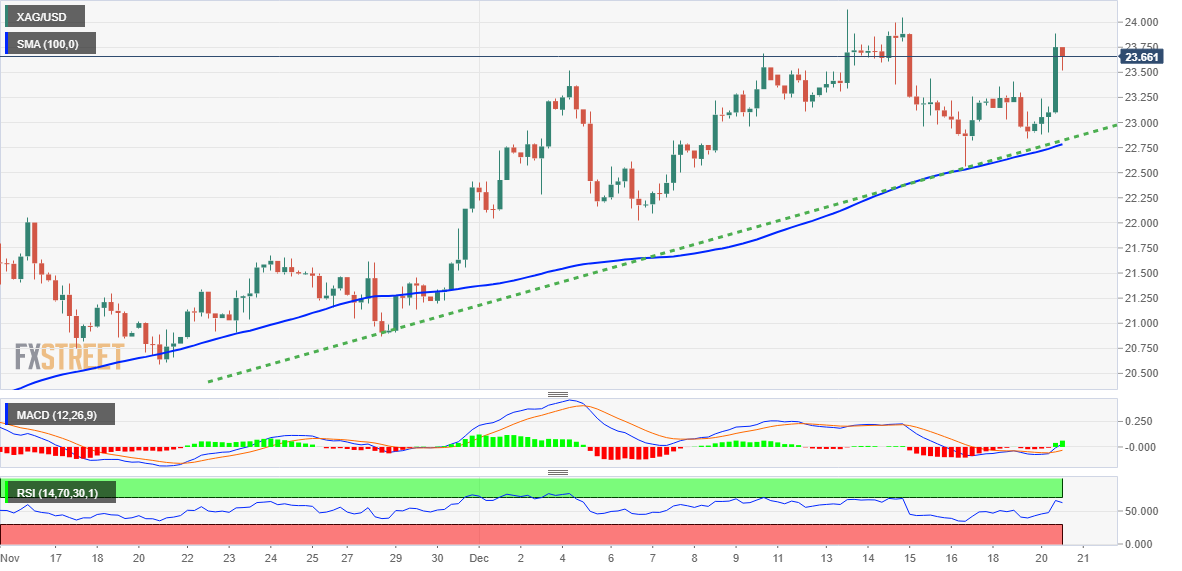
Given the recent bounce from a confluence comprising an ascending trend-line extending from November low and the 100-period SMA on the 4-hour chart, the bias seems tilted in favour of bulls. The positive outlook is reinforced by the fact that oscillators on the daily chart are holding comfortably in the bullish territory and have again started gaining traction on the 4-hour chart.

That said, RSI (14) on the 1-hour chart flashes slightly overbought conditions and holds back traders from positioning for any further gains. Nevertheless, the XAG/USD still seems poised to surpass the $24.00 mark and retest the multi-month top, around the $24.10-$24.15 area touched earlier this month. Some follow-through buying should pave the way for additional near-term gains.

On the flip side, the $23.30 horizontal support now seems to protect the immediate downside ahead of the $23.00 mark and the aforementioned confluence, currently around the $22.80 region. A convincing break below will negate the constructive set-up and prompt aggressive technical selling. The XAG/USD might then slide to the next relevant support near the $22.00 round figure.

Silver 4-hour chart

fxsoriginal

Key levels to watch

XAG/USD

Overview
Today last price 23.56
Today Daily Change 0.61
Today Daily Change % 2.66
Today daily open 22.95
 
Trends
Daily SMA20 22.48
Daily SMA50 20.97
Daily SMA100 20.2
Daily SMA200 21.19
 
Levels
Previous Daily High 23.41
Previous Daily Low 22.84
Previous Weekly High 24.13
Previous Weekly Low 22.56
Previous Monthly High 22.25
Previous Monthly Low 18.84
Daily Fibonacci 38.2% 23.06
Daily Fibonacci 61.8% 23.19
Daily Pivot Point S1 22.72
Daily Pivot Point S2 22.49
Daily Pivot Point S3 22.15
Daily Pivot Point R1 23.3
Daily Pivot Point R2 23.64
Daily Pivot Point R3 23.87


Share: Feed news

Information on these pages contains forward-looking statements that involve risks and uncertainties. Markets and instruments profiled on this page are for informational purposes only and should not in any way come across as a recommendation to buy or sell in these assets. You should do your own thorough research before making any investment decisions. FXStreet does not in any way guarantee that this information is free from mistakes, errors, or material misstatements. It also does not guarantee that this information is of a timely nature. Investing in Open Markets involves a great deal of risk, including the loss of all or a portion of your investment, as well as emotional distress. All risks, losses and costs associated with investing, including total loss of principal, are your responsibility. The views and opinions expressed in this article are those of the authors and do not necessarily reflect the official policy or position of FXStreet nor its advertisers. The author will not be held responsible for information that is found at the end of links posted on this page.

If not otherwise explicitly mentioned in the body of the article, at the time of writing, the author has no position in any stock mentioned in this article and no business relationship with any company mentioned. The author has not received compensation for writing this article, other than from FXStreet.

FXStreet and the author do not provide personalized recommendations. The author makes no representations as to the accuracy, completeness, or suitability of this information. FXStreet and the author will not be liable for any errors, omissions or any losses, injuries or damages arising from this information and its display or use. Errors and omissions excepted.

The author and FXStreet are not registered investment advisors and nothing in this article is intended to be investment advice.

Recommended content


Recommended content

Editors’ Picks

AUD/USD tumbles toward 0.6350 as Middle East war fears mount

AUD/USD tumbles toward 0.6350 as Middle East war fears mount

AUD/USD has come under intense selling pressure and slides toward 0.6350, as risk-aversion intensifies following the news that Israel retaliated with missile strikes on a site in Iran. Fears of the Israel-Iran strife translating into a wider regional conflict are weighing on the higher-yielding Aussie Dollar. 

AUD/USD News

USD/JPY breaches 154.00 as sell-off intensifies on Israel-Iran escalation

USD/JPY breaches 154.00 as sell-off intensifies on Israel-Iran escalation

USD/JPY is trading below 154.00 after falling hard on confirmation of reports of an Israeli missile strike on Iran, implying that an open conflict is underway and could only spread into a wider Middle East war. Safe-haven Japanese Yen jumped, helped by BoJ Governor Ueda's comments. 

USD/JPY News

Gold price jumps above $2,400 as MidEast escalation sparks flight to safety

Gold price jumps above $2,400 as MidEast escalation sparks flight to safety

Gold price has caught a fresh bid wave, jumping beyond $2,400 after Israel's retaliatory strikes on Iran sparked a global flight to safety mode and rushed flows into the ultimate safe-haven Gold. Risk assets are taking a big hit, as risk-aversion creeps into Asian trading on Friday. 

Gold News

WTI surges to $85.00 amid Israel-Iran tensions

WTI surges to $85.00 amid Israel-Iran tensions

Western Texas Intermediate, the US crude oil benchmark, is trading around $85.00 on Friday. The black gold gains traction on the day amid the escalating tension between Israel and Iran after a US official confirmed that Israeli missiles had hit a site in Iran.

Oil News

Dogwifhat price pumps 5% ahead of possible Coinbase effect

Dogwifhat price pumps 5% ahead of possible Coinbase effect

Dogwifhat price recorded an uptick on Thursday, going as far as to outperform its peers in the meme coins space. Second only to Bonk Inu, WIF token’s show of strength was not just influenced by Bitcoin price reclaiming above $63,000.

Read more

Forex MAJORS

Cryptocurrencies

Signatures