|

Silver Price Analysis: XAG/USD retraces toward $22.20s on upbeat mood, dragonfly doji surfaces

  • XAG/USD drops on risk-on mood and technical factors as a dragonfly doji emerges.
  • If the XAG/USD drops below $22.00, sellers would face support barricades in the $21.80-90 area.
  • XAG/USD Price Analysis: To consolidate around familiar levels ahead of the FOMC’s decision.

Silver price reversed its bullish course, dropping around 1.20% late in the mid-North American session. After hitting a seven-week high of $22.71 on Monday, the XAG/USD has retraced some of those gains, trading nearby March’s 20 daily low of $22.22. At the time of writing, the XAG/USD is trading at $22.29, down 0.27 percent.

XAG/USD Price action

The week began with the white metal printing a new multi-week high before reversing and closing above $22.50. On its way north, the XAG/USD reclaimed the 200-day EMA, shifting the white metal bias to neutral upwards. Nevertheless, a dragonfly doji emerged at the daily, exacerbating Silver’s fall toward the $22.20 area.

If XAG/USD tumbles below $22.00, that would pave the way for a dip to the 50-day EMA at $21.91, immediately followed by the 100-day EMA At $21.89. Once cleared, the 200-day EMA at $21.81 would be next, ahead of falling to the 20-day EMA at $21.60.

Conversely, the XAG/USD first resistance would be the March 17 daily high at $22.59, followed by the March 20 high at $22.71. Upside risks remain above $23.00.

XAG/USD Daily chart
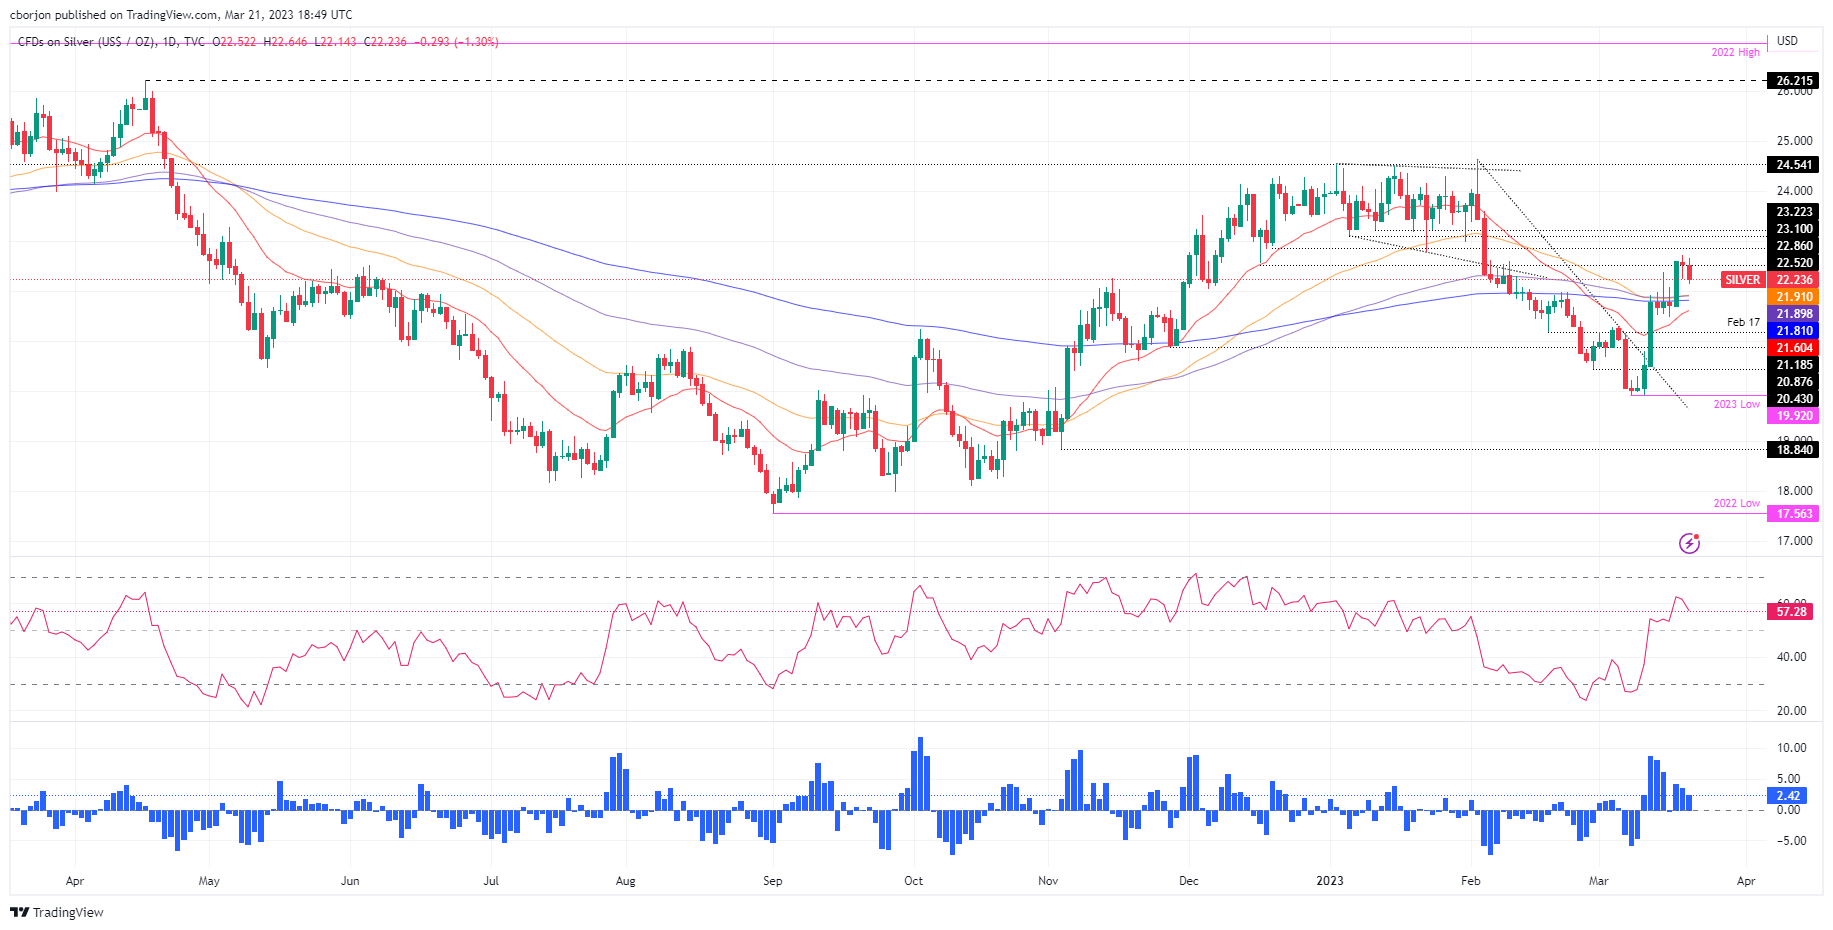
XAG/USD Daily chart

XAG/USD Technical levels

XAG/USD

Overview
Today last price22.3
Today Daily Change-0.25
Today Daily Change %-1.11
Today daily open22.55
 
Trends
Daily SMA2021.2
Daily SMA5022.31
Daily SMA10022.36
Daily SMA20020.95
 
Levels
Previous Daily High22.72
Previous Daily Low22.22
Previous Weekly High22.61
Previous Weekly Low20.54
Previous Monthly High24.64
Previous Monthly Low20.42
Daily Fibonacci 38.2%22.41
Daily Fibonacci 61.8%22.53
Daily Pivot Point S122.28
Daily Pivot Point S222
Daily Pivot Point S321.78
Daily Pivot Point R122.77
Daily Pivot Point R222.99
Daily Pivot Point R323.27

Author

Christian Borjon Valencia

Markets analyst, news editor, and trading instructor with over 14 years of experience across FX, commodities, US equity indices, and global macro markets.


More from Christian Borjon Valencia
Share:

Editor's Picks

GBP/USD holds recovery gains near 1.3400 despite soft UK CPI data

GBP/USD clings to recovery gains near 1.3400 in European trading on Wednesday. The UK annual Consumer Price Index (CPI) inflation cooled to 2.6% in June against the market forecast of 2.7%, failing to deter the British Pound's rebound from weekly troughs. However, the pair's further upside could be limited by ongoing Mideast tensions and sustained US Dollar demand as a haven.

EUR/USD gains ground above 1.1400 on hawkish ECB tone

The EUR/USD pair holds positive ground near 1.1410 during the early European trading hours, bolstered by a hawkish tone from the European Central Bank. However, the potential upside for the major pair might be limited amid escalating military tensions and recent retaliatory airstrikes between the US and Iran.

Gold ease from two-week top as energy-driven inflation fears bolster Fed hike bets

Gold retreats slightly from a two-week high touched earlier this Wednesday, albeit it retains an intraday bullish bias through the first half of the European session. Hopes that US-Iran diplomacy could ease energy prices and temper hawkish US Federal Reserve expectations undermine the US Dollar, which is seen supporting the commodity. In fact, top negotiators for Iran and the US signaled that they have not walked away from talks.

Cardano: Short-term recovery lacks retail support

Cardano price edges lower after the 50-day Exponential Moving Average at $1.770 capped two consecutive days of recovery seen earlier this week. ADA futures point to waning retail traction as Open Interest and trading volume decline amid elevated long liquidations. The technical outlook for ADA is bearish, as momentum remains subdued below a resistance trendline near $0.1782.

Chip stocks are more volatile than Oil

I continue to start the day by looking at these two charts: US crude & Kospi. The former is extending gains, trading above $86 per barrel for WTI and $92 per barrel for Brent, while the Kospi is up more than 4.5%, led higher by Korean chipmakers following a similar jump in VanEck's Semiconductor ETF yesterday.

US Dollar mid-year outlook: Exceptional currency, exceptional risks?
The US Dollar enters the second half of 2026 in a markedly different position from a year ago. The King currency has recovered, reflecting persistent US inflation, changing expectations for Fed policy, geopolitical tensions and renewed demand for defensive assets.















