Silver Price Analysis: XAG/USD recovers but stalls below the 200-day EMA, as RSI remains bearish


  • Silver struggles below the 200-day EMA, trading nearly flat.
  • Bearish indicators suggest downward potential despite some buying pressure.
  • A daily close above 200-day EMA could spark a rebound to $23.00.

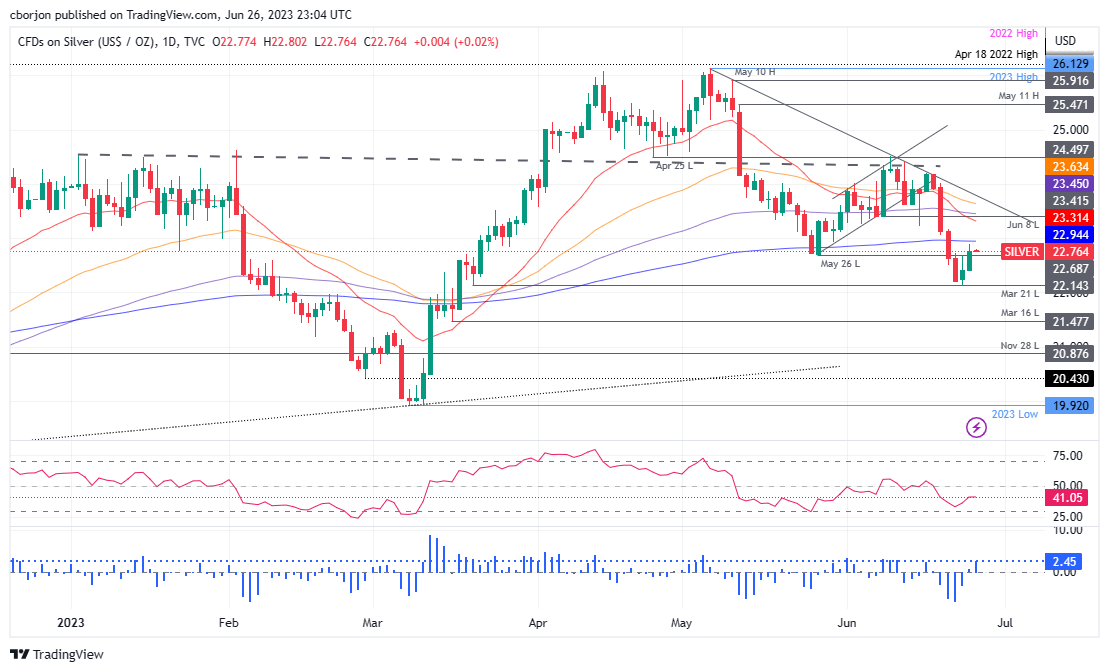
Silver price advances sharply during the week, though as the Asian session begins, the XAG/USD is facing solid resistance at the 200-day Exponential Moving Average (EMA) at $22.94. That said, the Silver (XAG/USD) spot is trading at $22.77, almost flat, at the time of writing.

XAG/USD Price Analysis: Technical outlook

XAG/USD shifted bearish once it fell below the 200-day EMA and beneath the May 26 daily low of $22.68. Even though XAG/USD hovers above the latter, a daily close above it’s required to keep buyers hopeful of reclaiming higher prices, like the 200-day EMA, ahead of the $23.00 barrier.

Nevertheless, the XAG/USD’s path of least resistance is downward biased, as shown by the Relative Strength Index (RSI) indicator, at bearish territory. At the same time, the three-day Rate of Change (RoC) portrays some buying pressure lifted the XAG/USD.

That said, the XAG/USD first support would be $22.68. A breach of the latter will expose the XAG/USD last week’s low of $22.11 before dropping beneath the $22.00 mark. Conversely, if XAG/USD achieves a daily close above the 200-day EMA, the XAG/USD could challenge $23.00 as the first resistance. Break above will expose the 20-day EMA at $23.31, followed by the 100-day EMA at $23.45.

XAG/USD Price Action – Daily chart

XAG/USD Daily chart

XAG/USD

Overview
Today last price 22.78
Today Daily Change 0.34
Today Daily Change % 1.52
Today daily open 22.44
 
Trends
Daily SMA20 23.54
Daily SMA50 24.19
Daily SMA100 23.32
Daily SMA200 22.49
 
Levels
Previous Daily High 22.68
Previous Daily Low 22.11
Previous Weekly High 24.2
Previous Weekly Low 22.11
Previous Monthly High 26.14
Previous Monthly Low 22.68
Daily Fibonacci 38.2% 22.47
Daily Fibonacci 61.8% 22.33
Daily Pivot Point S1 22.14
Daily Pivot Point S2 21.84
Daily Pivot Point S3 21.57
Daily Pivot Point R1 22.71
Daily Pivot Point R2 22.98
Daily Pivot Point R3 23.28


Share: Feed news

Information on these pages contains forward-looking statements that involve risks and uncertainties. Markets and instruments profiled on this page are for informational purposes only and should not in any way come across as a recommendation to buy or sell in these assets. You should do your own thorough research before making any investment decisions. FXStreet does not in any way guarantee that this information is free from mistakes, errors, or material misstatements. It also does not guarantee that this information is of a timely nature. Investing in Open Markets involves a great deal of risk, including the loss of all or a portion of your investment, as well as emotional distress. All risks, losses and costs associated with investing, including total loss of principal, are your responsibility. The views and opinions expressed in this article are those of the authors and do not necessarily reflect the official policy or position of FXStreet nor its advertisers. The author will not be held responsible for information that is found at the end of links posted on this page.

If not otherwise explicitly mentioned in the body of the article, at the time of writing, the author has no position in any stock mentioned in this article and no business relationship with any company mentioned. The author has not received compensation for writing this article, other than from FXStreet.

FXStreet and the author do not provide personalized recommendations. The author makes no representations as to the accuracy, completeness, or suitability of this information. FXStreet and the author will not be liable for any errors, omissions or any losses, injuries or damages arising from this information and its display or use. Errors and omissions excepted.

The author and FXStreet are not registered investment advisors and nothing in this article is intended to be investment advice.

Recommended content


Recommended content

Editors’ Picks

AUD/USD: Further losses retarget the 200-day SMA

AUD/USD: Further losses retarget the 200-day SMA

Further gains in the greenback and a bearish performance of the commodity complex bolstered the continuation of the selling pressure in AUD/USD, which this time revisited three-day lows near 0.6560.

AUD/USD News

EUR/USD: Further weakness remains on the cards

EUR/USD: Further weakness remains on the cards

EUR/USD added to Tuesday’s pullback and retested the 1.0730 region on the back of the persistent recovery in the Greenback, always against the backdrop of the resurgence of the Fed-ECB monetary policy divergence.

EUR/USD News

Gold flirts with $2,320 as USD demand losses steam

Gold flirts with $2,320 as USD demand losses steam

Gold struggles to make a decisive move in either direction and moves sideways in a narrow channel above $2,300. The benchmark 10-year US Treasury bond yield clings to modest gains near 4.5% and limits XAU/USD's upside.

Gold News

Bitcoin price dips to $61K range, encourages buying spree among BTC fish, dolphins and sharks

Bitcoin price dips to $61K range, encourages buying spree among BTC fish, dolphins and sharks

Bitcoin (BTC) price is chopping downwards on the one-day time frame, while the outlook seen in the one-week period is a horizontal trade. In this shakeout moment, data shows that large holders are using the correction to buy up BTC.

Read more

Navigating the future of precious metals

Navigating the future of precious metals

In a recent episode of the Vancouver Resource Investment Conference podcast, hosted by Jesse Day, guests Stefan Gleason and JP Cortez shared their expert analysis on the dynamics of the gold and silver markets and discussed legislative efforts to promote these metals as sound money in the United States.

Read more

Forex MAJORS

Cryptocurrencies

Signatures