Silver Price Analysis: XAG/USD pierces $26.00 to renew eight-month high
- Silver began the week on a front foot around the highest levels since mid-July 2021.
- Clear upside break of 50% Fibonacci retracement level keeps buyers hopeful.
- Momentum line hints at a pullback towards the previous resistance line, bears remain away beyond 200-DMA.

Silver (XAG/USD) begins the week’s trading with an upside gap to $26.00, the highest levels in eight months, following a six-week uptrend.
In doing so, the bright metal crosses the 50% Fibonacci retracement of February-September 2021 moves.
The upside rally also gains support from the quote’s sustained trading beyond the 200-DMA and a clear break of a downward sloping trend line from early 2021.
However, the Momentum line hints that the XAG/USD bulls lack ammunition, which in turn may trigger the quote’s pullback towards the resistance-turned-support line, near $25.10 by the press time.
Following that, January’s high of $24.70 may lure the metal sellers but the 200-DMA level surrounding $24.10 will challenge any further downside.
On the flip side, a convergence of the 61.8% Fibonacci retracement and July 2021 high challenges XAG/USD bulls around $26.75-80.
Should the quote remains firmer past $26.80, the $27.00 threshold and May 2021 peak of $28.75 will be in focus.
Silver: Daily chart
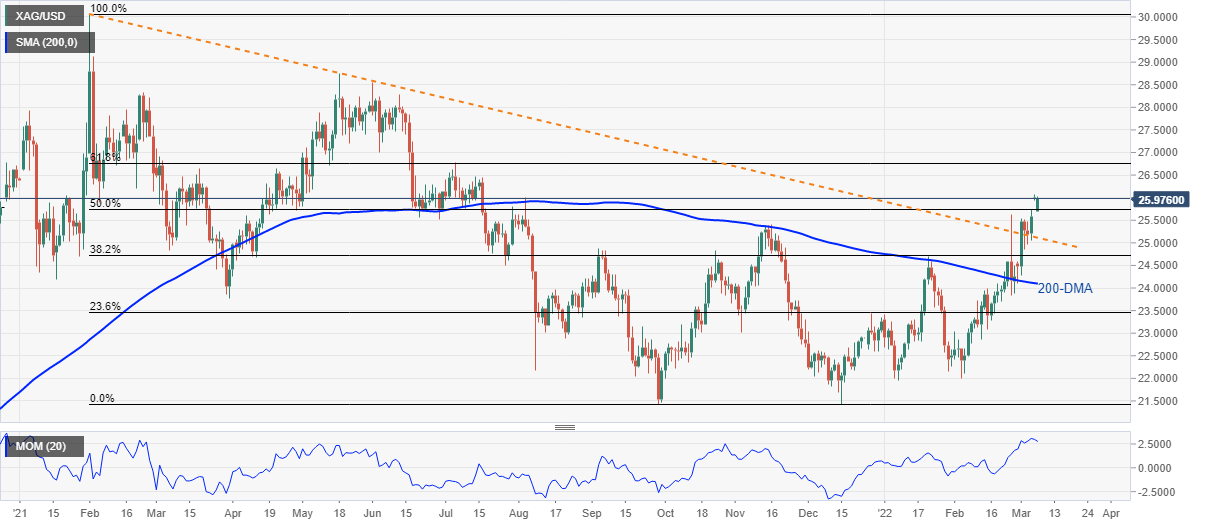
Trend: Bullish
Author

Anil Panchal
FXStreet
Anil Panchal has nearly 15 years of experience in tracking financial markets. With a keen interest in macroeconomics, Anil aptly tracks global news/updates and stays well-informed about the global financial moves and their implications.


