|

Silver Price Analysis: XAG/USD hangs near one-month low, seems vulnerable to slide further

  • Silver struggles to gain any meaningful traction for the second straight day on Friday.
  • The technical setup supports prospects for an extension of a multi-week downtrend.
  • Attempted recovery is likely to remain capped near the $23.30 support breakpoint.

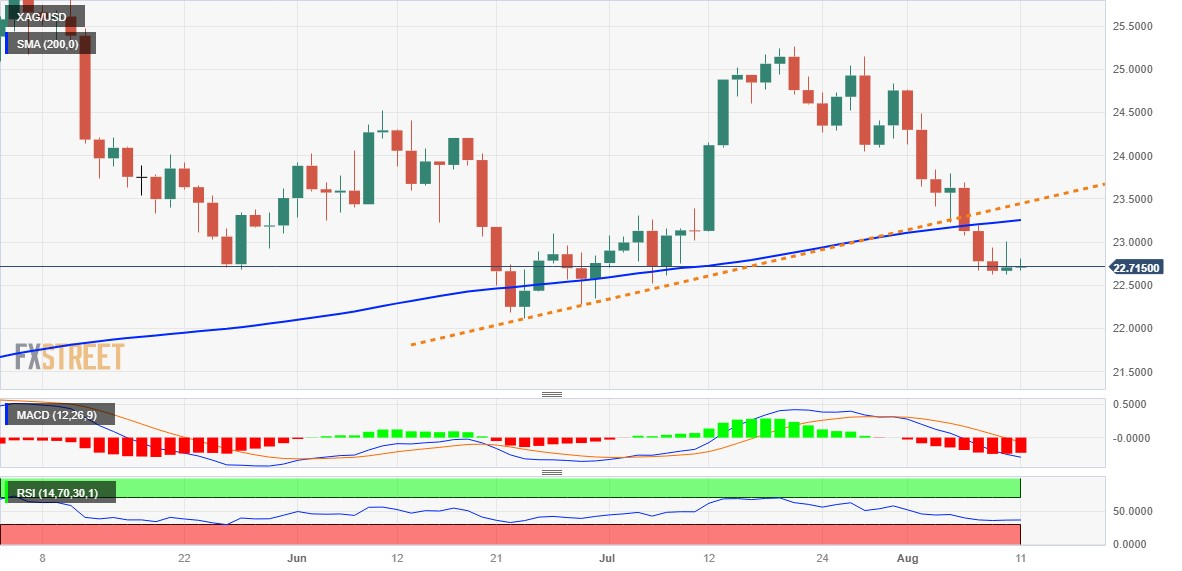
Silver lacks any firm intraday directional bias on Friday and seesaws between tepid gains/minor losses through the early part of the European session. The white metal currently trades around the $22.70 region, nearly unchanged for the day and just above over a one-month low touched on Wednesday.

The technical setup, meanwhile, suggests that the path of least resistance for the XAG/USD is to the downside. This week's sustained break below the $23.30-$23.20 confluence – comprising the very important 200-day Simple Moving Average (SMA) and a short-term ascending trend-line – was seen as a fresh trigger for bearish traders. Adding to this, oscillators on the daily chart are holding deep in the negative territory and are still far from being in the oversold zone. This, in turn, supports prospects for an extension of the recent downward trajectory witnessed over the past three weeks or so.

Hence, any subsequent move up towards the $23.00 round figure might still be seen as a selling opportunity and remain capped near the $23.20-$23.30 confluence support breakpoint, now turned resistance. The latter should act as a pivotal point, which if cleared decisively might trigger a short-covering move. The XAG/USD might then accelerate the recovery momentum towards the $23.60-$23.65 horizontal barrier before aiming to reclaim the $24.00 mark.

On the flip side, the $22.65-$22.60 area, or the weekly low, could act as immediate support. The XAG/USD, however, seems vulnerable to retesting the multi-month low, around the $22.15-$22.10 area touched in June. Some follow-through selling below the $22.00 mark will expose the $21.55-$21.50 intermediate support and the $21.00 mark. The downward trajectory could get extended towards the $21.00 round figure en route to the YTD low, or levels just below the $20.00 psychological mark touched in March.

Silver daily chart

fxsoriginal

Technical levels to watch

XAG/USD

Overview
Today last price22.74
Today Daily Change0.03
Today Daily Change %0.13
Today daily open22.71
 
Trends
Daily SMA2024.15
Daily SMA5023.68
Daily SMA10024.06
Daily SMA20023.24
 
Levels
Previous Daily High23
Previous Daily Low22.63
Previous Weekly High24.84
Previous Weekly Low23.23
Previous Monthly High25.27
Previous Monthly Low22.52
Daily Fibonacci 38.2%22.86
Daily Fibonacci 61.8%22.77
Daily Pivot Point S122.56
Daily Pivot Point S222.4
Daily Pivot Point S322.18
Daily Pivot Point R122.93
Daily Pivot Point R223.15
Daily Pivot Point R323.3

Author

Haresh Menghani

Haresh Menghani is a detail-oriented professional with 10+ years of extensive experience in analysing the global financial markets.

More from Haresh Menghani
Share:

Markets move fast. We move first.

Orange Juice Newsletter brings you expert driven insights - not headlines. Every day on your inbox.

By subscribing you agree to our Terms and conditions.

Editor's Picks

EUR/USD edges above 1.1750 due to ECB-Fed policy divergence

EUR/USD has recovered its recent losses registered in the previous session, trading around 1.1760 during the Asian hours on Friday. Traders will likely observe Germany’s Manufacturing Purchasing Managers’ Index data later in the day.

GBP/USD gathers strength above 1.3450 on Fed rate cut bets, BoE's gradual policy path

The GBP/USD pair gathers strength to around 1.3480 during the early Asian session on Friday. Expectations of the US Federal Reserve rate cuts this year weigh on the US Dollar against the Pound Sterling. Philadelphia Fed President Anna Paulson is set to speak later on the weekend. 

Gold climbs to near $4,350 on Fed rate cut bets, geopolitical risks

Gold price rises to near $4,345 during the early Asian session on Friday. Gold finished 2025 with a significant rally, achieving an annual gain of around 65%, its biggest annual gain since 1979. The rally of the precious metal is bolstered by the prospect of further US interest rate cuts in 2026 and safe-haven flows.

Bitcoin, Ethereum and Ripple enter the New Year with breakout hopes

Bitcoin, Ethereum, and Ripple entered the new year trading at key technical levels on Friday, as traders seek fresh directional cues in January. With BTC locked in a tight range, ETH is approaching its 50-day Exponential Moving Average, while XRP is nearing resistance. A clear breakout across these top three cryptocurrencies could help define market momentum in the opening weeks of the year.

Economic outlook 2026-2027 in advanced countries: Solidity test

After a year marked by global economic resilience and ending on a note of optimism, 2026 looks promising and could be a year of solid economic performance. In our baseline scenario, we expect most of the supportive factors at work in 2025 to continue to play a role in 2026.

Crypto market outlook for 2026

Year 2025 was volatile, as crypto often is.  Among positive catalysts were favourable regulatory changes in the U.S., rise of Digital Asset Treasuries (DAT), adoption of AI and tokenization of Real-World-Assets (RWA).