Silver Price Analysis: XAG/USD falls but remains capped by the 20-DMA at $24.70
- Silver price continues to trade below the $25.00 figure as support takes hold around $24.80.
- XAG/USD has been trading sideways, bracing around the 20-day EMA at $24.70 for the last three days.

Silver price trends downwards for the third straight day, though it stays above the 20-day Exponential Moving Average (EMA) after dipping to a daily low of $24.51. At the time of writing, the XAG/USD is trading at $24.81, below its opening price by 0.25%.
XAG/USD Price Action
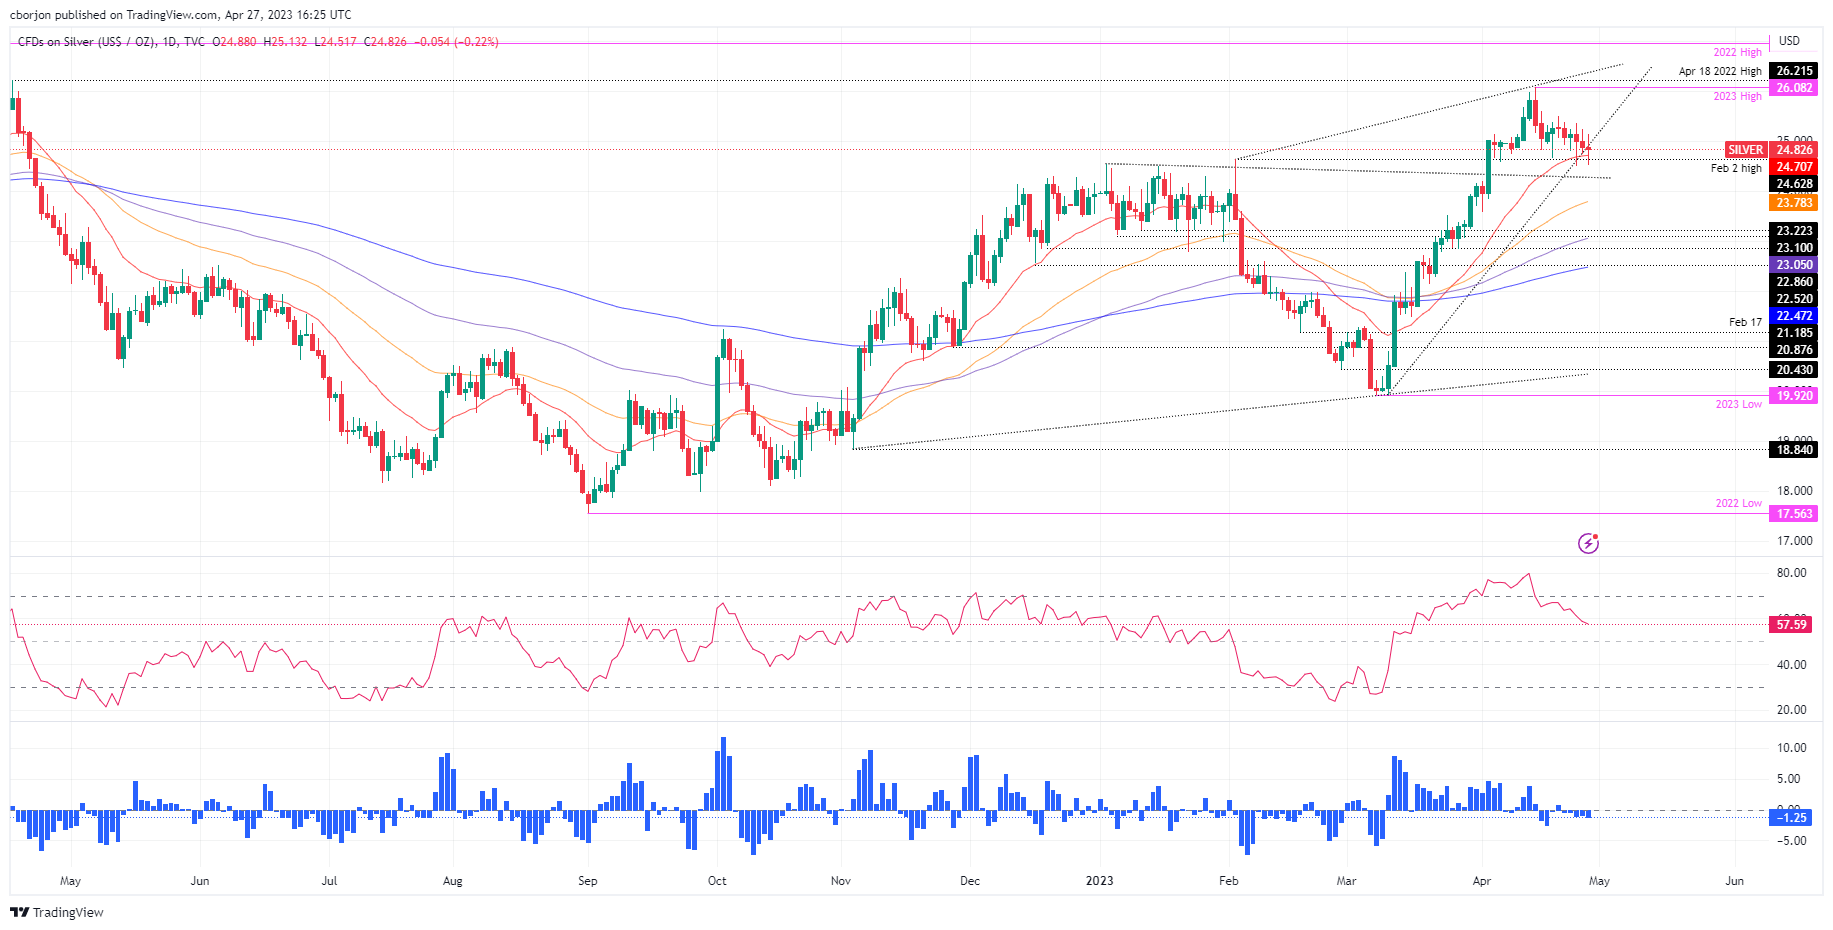
The XAG/USD is trading sideways, as it has been since April 18. Also, the Relative Strength Index (RSI), after bolstering the XAG/USD towards its YTD high of $26.08, has retreated, aiming towards the neutral area, as sellers continue to enter the market, as XAG/USD so far had failed to crack the 20-day EMA at $24.70. if XAG/USD sellers break below the latter, the next support would be a downslope resistance trendline, turned support, drawn from January highs, that passes around $24.20-30, ahead of posing a challenge to the $24.00 figure.
On the flip side, the XAG/USD first resistance would be the April 25 daily high at $25.23, followed by the April 20 cycle high at $25.49. The next resistance remains the YTD high at $26.08, followed by the last year’s high at $26.94.
XAG/USD Daily Chart
Author

Christian Borjon Valencia
FXStreet
Markets analyst, news editor, and trading instructor with over 14 years of experience across FX, commodities, US equity indices, and global macro markets.


