|

Silver Price Analysis: XAG/USD fades bounce off 200-SMA around mid-$19.00s

  • Silver price snaps three-day winning streak but sellers remain cautious of late.
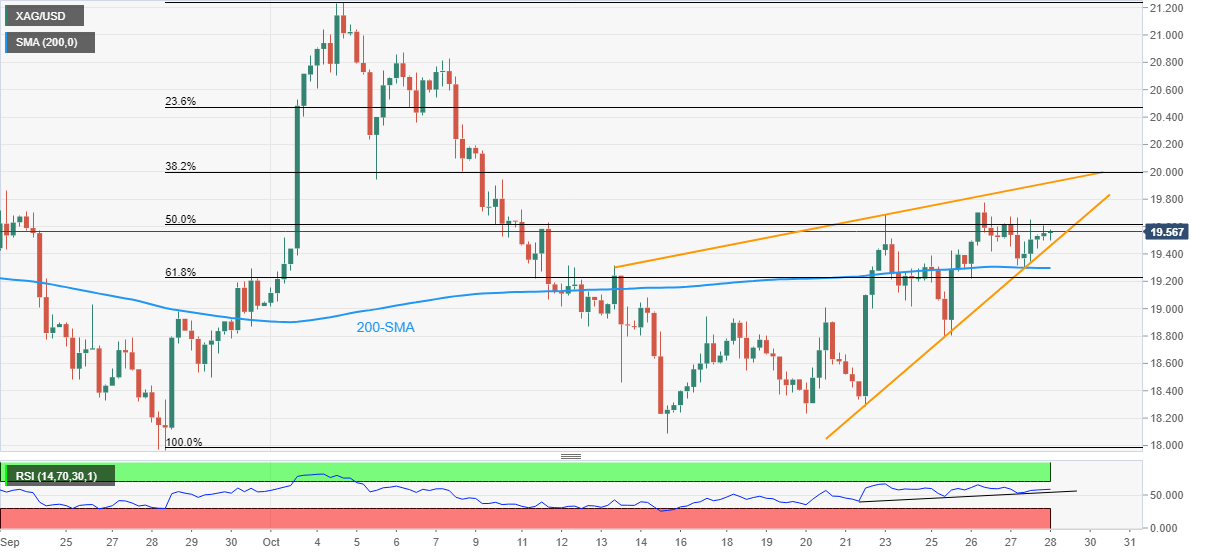
  • Firmer RSI, a struggle to break 200-SMA keep buyers hopeful.
  • Fortnight-old rising wedge bearish formation teases sellers amid a sluggish session.

Silver price (XAG/USD) prints the first loss-making day in three even as sellers make rounds to $19.50 during Friday’s Asian session.

In doing so, the bright metal fades the previous day’s bounce off the 200-SMA while staying inside a two-week-long rising wedge bearish chart pattern.

Given the gradual recovery of the RSI (14), the metal’s recovery in the last week appears interesting to lure buyers.

However, a clear upside break of the stated wedge’s resistance line, near $19.95, as well as a clearance of the $20.00 threshold, becomes necessary for the XAG/USD’s run-up.

Following that, $20.30 and $20.85 can challenge the silver buyers before directing them to the monthly peak surrounding $21.25.

Alternatively, the downside break of the $19.45 level comprising the immediate support line, forming part of the rising wedge, could lure the XAG/USD bears to challenge the 200-SMA level near $19.30.

In a case where silver bears remain dominant past $19.30, the $18.90 level may test the downside before highlighting the theoretical target of the rising wedge breakdown, close to $17.70.

Overall, the silver price may witness further downside but the bears need a solid trigger to push back the bullish hopes.

Silver: Four-hour chart

Trend: Further weakness expected

Additional important levels

Overview
Today last price19.56
Today Daily Change-0.04
Today Daily Change %-0.20%
Today daily open19.6
 
Trends
Daily SMA2019.45
Daily SMA5019.11
Daily SMA10019.59
Daily SMA20021.63
 
Levels
Previous Daily High19.67
Previous Daily Low19.3
Previous Weekly High19.44
Previous Weekly Low18.23
Previous Monthly High20.02
Previous Monthly Low17.56
Daily Fibonacci 38.2%19.53
Daily Fibonacci 61.8%19.44
Daily Pivot Point S119.37
Daily Pivot Point S219.15
Daily Pivot Point S319
Daily Pivot Point R119.75
Daily Pivot Point R219.9
Daily Pivot Point R320.12

Author

Anil Panchal

Anil Panchal

FXStreet

Anil Panchal has nearly 15 years of experience in tracking financial markets. With a keen interest in macroeconomics, Anil aptly tracks global news/updates and stays well-informed about the global financial moves and their implications.

More from Anil Panchal
Share:

Editor's Picks

EUR/USD remains on the back foot around 1.1700

EUR/USD is coming under heavy selling pressure, hovering around the 1.1700 region in the latter part of the NA session on Monday. The pair’s severe retracement comes as the US Dollar stages a marked bounce on the back of the prevailing flight to safety atmosphere, as investors react to the escalating conflict in the Middle East.

GBP/USD hits new yearly lows near 1.3300

GBP/USD adds to the recent bearish tone, approaching to the key 1.3300 support to reach fresh YTD troughs against the backdrop of the robust performance of the US Dollar. Indeed, Cable’s decline comes amid the firm demand for the safe-haven space in the wake of the US and Israel attacks to Iran.

Gold eases some ground, approaches $5,300

Gold now surrenders part of the earlier advance, reshifting its attenton to the $5,300 zone per troy ounce at the beginning of the week. Indeed, the yellow metal’s firm performance appears propped up by incresing geopolitical jitters in the Middle East, which at the same time fuels the demand for the safe-haven space.

Bitcoin on brink of breakdown amid US-Iran war

Bitcoin (BTC) remains under pressure near the key support level of $65,700. Trading at $66,400 at the time of writing on Monday, a breakdown below this critical level would suggest a deeper correction ahead.

The Fed is finally talking about AI – Here's why it matters for the US Dollar

AI is moving from earnings calls into the heart of monetary policy discussions, forcing Federal Reserve officials to confront a new question: How to act if AI reshapes inflation, employment and interest rates at the same time?

Grass 20% bullish breakout defies broader market weakness

Grass (GRASS) is edging up above $0.30 at the time of writing on Monday. The token’s notable 20% intraday surge stands out amid heightened volatility in the broader crypto market.