- Silver price is upward biased from a monthly chart perspective.
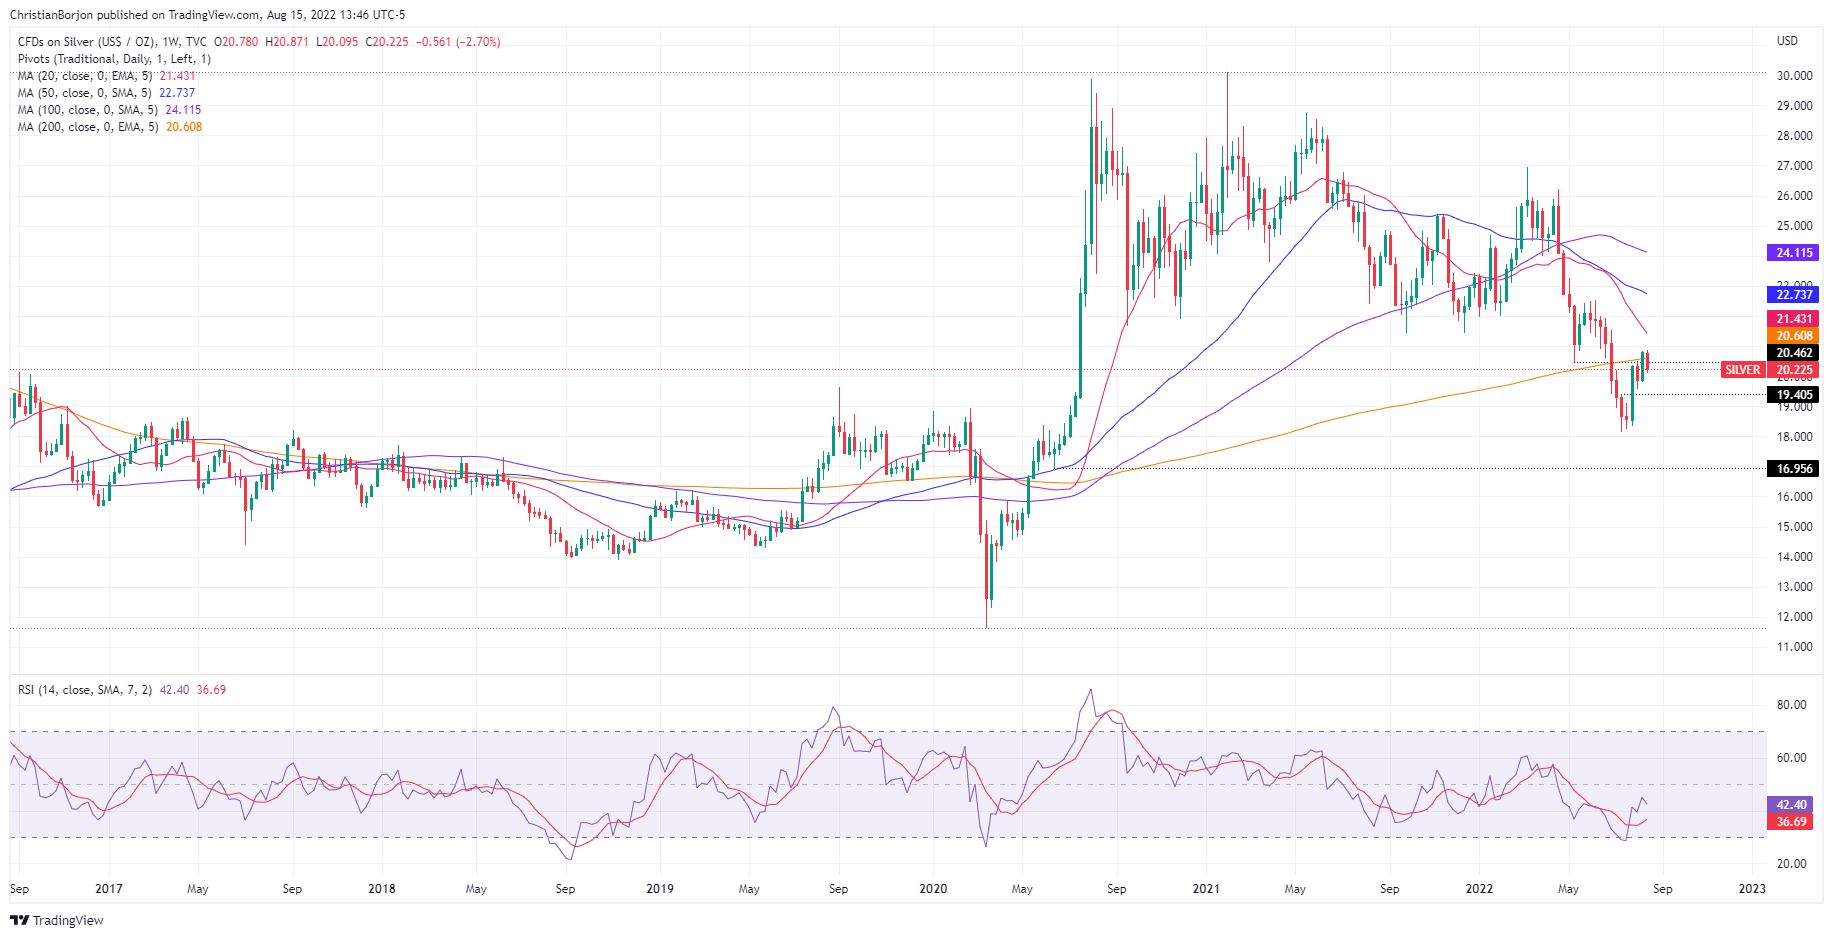
- In the weekly chart, XAG/USD remains below its 200-week EMA, downward biased.
- XAG/USD daily chart illustrates silver as neutral-to-downwards, though a bearish-engulfing candle pattern suggests a leg-down is on the cards.
Silver price edges lower during Monday’s North American session, down by 2.40% courtesy of US dollar strength, despite falling US Treasury bond yields, ahead of the release of the last FOMC monetary policy minutes. At the time of writing, the XAG/USD formed a bearish-engulfing candle pattern, trading at $20.23.
Silver Price Analysis (XAG/USD): Technical outlook
The white metal outlook looks more positive than negative from a monthly chart perspective. July’s price action formed a dragonfly-doji in a crowded area with the 50, 100, and 200-monthly MAs lying around the $18.48-$20.17 region, which could pave the way for further gains. On the topside, the 20-month EMA at $23.81 might cap further XAG/USD gains.
In the meantime, the XAG/USD weekly chart portrays the non-yielding metal struggling at the 200-week MA at $20.60. Nevertheless, unless sellers push silver below $19.80, buyers could remain hopeful of higher prices, though they would face a wall of resistance at around $21.48, the 20-week EMA. Once cleared, it would pave the way towards the 50-week EMA at $22.73, ahead of the 100-week at $24.11.
The XAG/USD daily chart portrays silver as neutral-to-downwards biased. As previously mentioned, a bearish-engulfing candle pattern surfaced. Still, the 50-day EMA at $20.18 is a difficult support level to overcome for sellers, but the Relative Strength Index (RSI) aiming lower, towards the 50-midline, might open the door to further losses.
If XAG/USD sellers achieve a daily close below the above-mentioned, the XAG/USD next support would be the $20.00 figure, which, once cleared, could test the 20-day EMA at $19.73. On the flip side, if XAG/USD buyers hold the fort above the former, then the XAG/USD first resistance would be the $21.00 figure. A break below will expose crucial resistance levels, like the 50-day EMA at $21.68, followed by the 200-day EMA at $22.68.
Silver (XAG/USD) Key Technical Levels
Information on these pages contains forward-looking statements that involve risks and uncertainties. Markets and instruments profiled on this page are for informational purposes only and should not in any way come across as a recommendation to buy or sell in these assets. You should do your own thorough research before making any investment decisions. FXStreet does not in any way guarantee that this information is free from mistakes, errors, or material misstatements. It also does not guarantee that this information is of a timely nature. Investing in Open Markets involves a great deal of risk, including the loss of all or a portion of your investment, as well as emotional distress. All risks, losses and costs associated with investing, including total loss of principal, are your responsibility. The views and opinions expressed in this article are those of the authors and do not necessarily reflect the official policy or position of FXStreet nor its advertisers. The author will not be held responsible for information that is found at the end of links posted on this page.
If not otherwise explicitly mentioned in the body of the article, at the time of writing, the author has no position in any stock mentioned in this article and no business relationship with any company mentioned. The author has not received compensation for writing this article, other than from FXStreet.
FXStreet and the author do not provide personalized recommendations. The author makes no representations as to the accuracy, completeness, or suitability of this information. FXStreet and the author will not be liable for any errors, omissions or any losses, injuries or damages arising from this information and its display or use. Errors and omissions excepted.
The author and FXStreet are not registered investment advisors and nothing in this article is intended to be investment advice.
Recommended content
Editors’ Picks
EUR/USD clings to gains near 1.0700, awaits key US data
EUR/USD clings to gains near the 1.0700 level in early Europe on Thursday. Renewed US Dollar weakness offsets the risk-off market environment, supporting the pair ahead of the key US GDP and PCE inflation data.
USD/JPY keeps pushing higher, eyes 156.00 ahead of US GDP data
USD/JPY keeps breaking into its highest chart territory since June of 1990 early Thursday, recapturing 155.50 for the first time in 34 years as the Japanese Yen remains vulnerable, despite looming intervention risks. The focus shifts to Thursday's US GDP report and the BoJ decision on Friday.
Gold price lacks firm intraday direction, holds steady above $2,300 ahead of US data
Gold price remains confined in a narrow band for the second straight day on Thursday. Reduced Fed rate cut bets and a positive risk tone cap the upside for the commodity. Traders now await key US macro data before positioning for the near-term trajectory.
Injective price weakness persists despite over 5.9 million INJ tokens burned
Injective price is trading with a bearish bias, stuck in the lower section of the market range. The bearish outlook abounds despite the network's deflationary efforts to pump the price. Coupled with broader market gloom, INJ token’s doomed days may not be over yet.
Meta takes a guidance slide amidst the battle between yields and earnings
Meta's disappointing outlook cast doubt on whether the market's enthusiasm for artificial intelligence. Investors now brace for significant macroeconomic challenges ahead, particularly with the release of first-quarter gross domestic product (GDP) data on Thursday.