Silver Price Analysis: XAG/USD dips beneath $29.00; further downside seen
- Silver drops over 1%, closes below $29.00, pressured by higher US Treasury yields.
- Bearish momentum intensifies; RSI decline hints at further losses.
- Key supports: 100-DMA at $28.43, $28.00, and cycle low at $26.02 (May 2).

Silver price failed to extend its gains on Wednesday and lost over 1% as US Treasury yields rose following a US 5-year Note auction. The XAG/USD trades at $28.83, finally achieving a daily close beneath $29.00, opening the door for further downside.
XAG/USD Price Analysis: Technical outlook
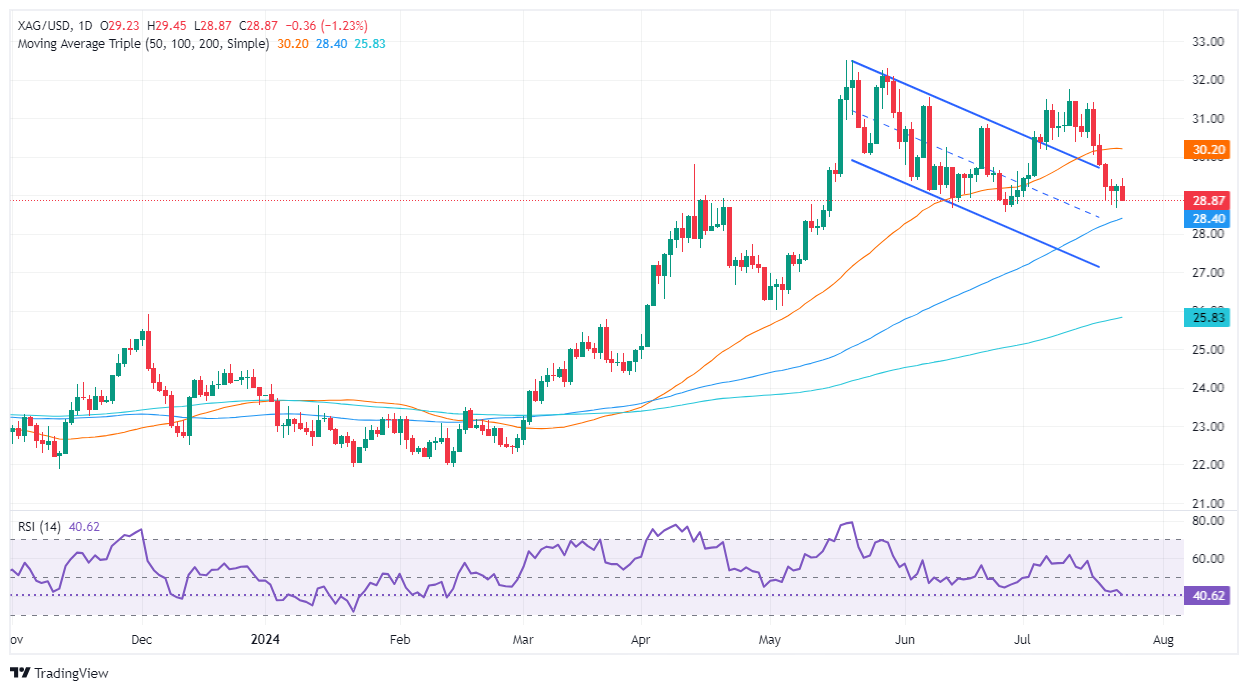
From a technical perspective, the XAG/USD dropped beneath $29.00 and is set to extend its losses past the June 26 low of $28.57. Momentum shows that sellers are in charge as the Relative Strength Index (RSI) accelerates to the downside, remaining bearish and with enough room before turning oversold.
That said, the path of least resistance is to the downside. The XAG/USD's first support would be the 100-day moving average (DMA) at $28.43. Once cleared, the next stop would be the psychological area at $28.00 before edging towards the latest cycle low seen at $26.02, the May 2 low.
Conversely, the grey metal could test higher prices if XAG/USD rallies past the $29.00 mark. The first resistance would be the July 22 high of $29.42. Once surpasses, the next stop is seen above the July 19 peak at $29.83. Further upside is anticipated above that level, with the $30.00 mark lying overhead.
XAG/USD Price Action – Daily Chart
Silver FAQs
Silver is a precious metal highly traded among investors. It has been historically used as a store of value and a medium of exchange. Although less popular than Gold, traders may turn to Silver to diversify their investment portfolio, for its intrinsic value or as a potential hedge during high-inflation periods. Investors can buy physical Silver, in coins or in bars, or trade it through vehicles such as Exchange Traded Funds, which track its price on international markets.
Silver prices can move due to a wide range of factors. Geopolitical instability or fears of a deep recession can make Silver price escalate due to its safe-haven status, although to a lesser extent than Gold's. As a yieldless asset, Silver tends to rise with lower interest rates. Its moves also depend on how the US Dollar (USD) behaves as the asset is priced in dollars (XAG/USD). A strong Dollar tends to keep the price of Silver at bay, whereas a weaker Dollar is likely to propel prices up. Other factors such as investment demand, mining supply – Silver is much more abundant than Gold – and recycling rates can also affect prices.
Silver is widely used in industry, particularly in sectors such as electronics or solar energy, as it has one of the highest electric conductivity of all metals – more than Copper and Gold. A surge in demand can increase prices, while a decline tends to lower them. Dynamics in the US, Chinese and Indian economies can also contribute to price swings: for the US and particularly China, their big industrial sectors use Silver in various processes; in India, consumers’ demand for the precious metal for jewellery also plays a key role in setting prices.
Silver prices tend to follow Gold's moves. When Gold prices rise, Silver typically follows suit, as their status as safe-haven assets is similar. The Gold/Silver ratio, which shows the number of ounces of Silver needed to equal the value of one ounce of Gold, may help to determine the relative valuation between both metals. Some investors may consider a high ratio as an indicator that Silver is undervalued, or Gold is overvalued. On the contrary, a low ratio might suggest that Gold is undervalued relative to Silver.
Author

Christian Borjon Valencia
FXStreet
Markets analyst, news editor, and trading instructor with over 14 years of experience across FX, commodities, US equity indices, and global macro markets.


