|

Silver Price Analysis: XAG/USD defends 100-hour SMA, trades with modest gains below $23.00

  • Silver regains positive traction on Thursday, albeit lacks follow-through buying.
  • The mixed technical setup warrants caution before placing any directional bets.
  • A sustained strength beyond $23.00 should pave the way for additional gains.

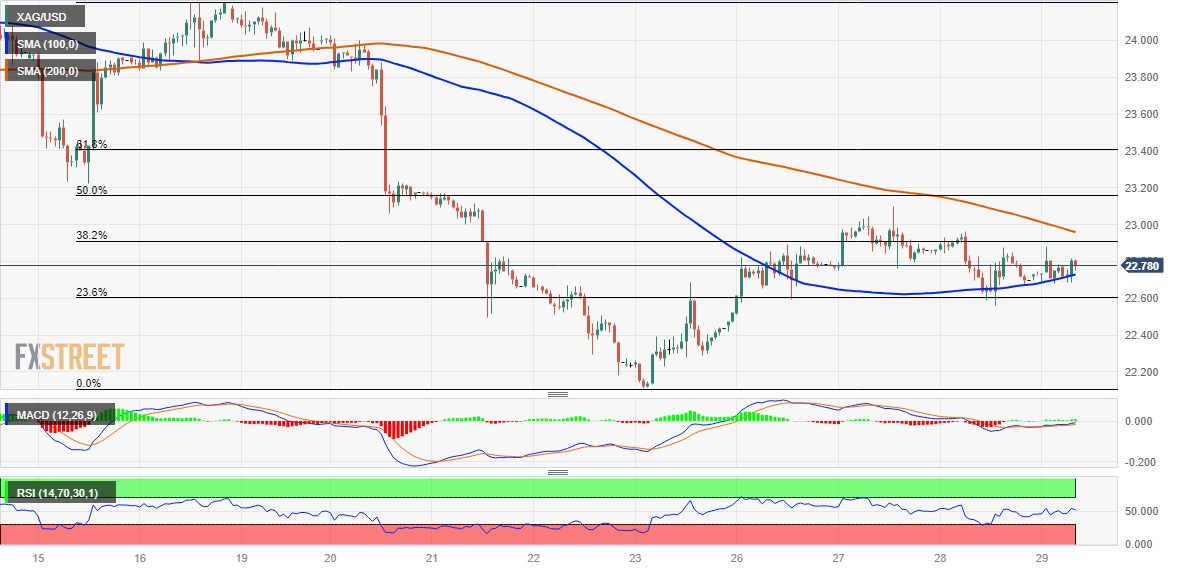
Silver attracts some buyers near the 100-hour Simple Moving Average (SMA) on Thursday and reverses a major part of its losses recorded the previous day; The white metal, however, struggles to make it through the 38.2% Fibonacci retracement level of the last week's downfall and trades around the $22.75-$22.80 region, up over 0.40% for the day during the first half of the European session.

From a technical perspective, the XAG/USD this week struggles to find acceptance above the $23.00 mark and faced rejection just ahead of the 50% Fibo. level. The subsequent downfall, however, stalls near the $22.55 confluence, comprising the 100-hour SMA and the 23.6% Fibo. level. The said ares should now act as a pivotal point, which if broken decisively will be seen as a fresh trigger for bearish traders. The XAG/USD might slide back to retest the multi-month low, around the $22.10 region touched last week.

Some follow-through selling below the $22.00 mark should pave the way for deeper losses and accelerate the fall further towards the $21.70-$21.65 zone. The downward trajectory could get extended further towards the next relevant support near the $21.25 region before the XAG/USD eventually drops to the $21.00 round figure.

On the flip side, any further intraday move up might continue to confront stiff resistance near the $23.00 mark, or 200-hour SMA. This is closely followed by the 50% Fibo., around the $23.15 region, and the $23.40 area, or the 61.8% Fibo. A convincing break through the latter will confirm that the XAG/USD has formed a near-term bottom just ahead of the $22.00 mark and trigger a fresh bout of a short-covering rally. This should pave the for some meaningful appreciating move and lift the white metal to the $23.65-$23.70 hurdle.

Silver 1-hour chart
fxsoriginal

Key levels to watch

XAG/USD

Overview
Today last price22.79
Today Daily Change0.09
Today Daily Change %0.40
Today daily open22.7
 
Trends
Daily SMA2023.46
Daily SMA5024.04
Daily SMA10023.34
Daily SMA20022.54
 
Levels
Previous Daily High22.96
Previous Daily Low22.56
Previous Weekly High24.2
Previous Weekly Low22.11
Previous Monthly High26.14
Previous Monthly Low22.68
Daily Fibonacci 38.2%22.72
Daily Fibonacci 61.8%22.81
Daily Pivot Point S122.52
Daily Pivot Point S222.34
Daily Pivot Point S322.12
Daily Pivot Point R122.92
Daily Pivot Point R223.14
Daily Pivot Point R323.32

Author

Haresh Menghani

Haresh Menghani is a detail-oriented professional with 10+ years of extensive experience in analysing the global financial markets.


More from Haresh Menghani
Share:

Editor's Picks

GBP/USD clings to 1.3500 amid marginal losses

GBP/USD alternates gains with losses around the 1.3500 neighbourhood on Tuesday. Indeed, Cable struggles to further extend its incipient recovery in a context of continuous instability in the Middle East and modest gains in the Greenback.

EUR/USD remains slightly offered near 1.1530

EUR/USD trades with humble losses in the 1.1540-1.1530 band following the closing bell in Euroland on Tuesday. Indeed, the pair’s tepid decline comes amid the marginal advance in the US Dollar, as traders continue to closely follow developments in the Middle East and gear up for the upcoming US CPI data.

Gold loses the grip below $4,400

Gold retreats from its earlier tops and briefly revisited the $4,350 region per troy ounce on Tuesday. The yellow metal’s modest retracement follows lacklustre gains in the US Dollar and declining US Treasury yields across the curve, all amid steady uncertainty from the geopolitical landscape.

Crypto Today: Bitcoin and Ethereum consolidate, XRP dips as optimism for a US-Iran deal fades

Bitcoin (BTC) maintains a neutral outlook on Tuesday while testing support at $64,000. Investors appear to be sitting on the fence, awaiting a catalyst for a breakout above $65,000.

The inflation narrative is still way more important than the employment story
Core bonds sold off yesterday with the belly of the curve slightly underperforming in the US while European curves showed more of a bear flattening. Daily changes on the US curve varied between +4.7 bps (2-yr) and +6.4 bps (7-yr).
9-3: Is the Federal Reserve’s vote tally Warsh's new forward guidance?
The rate did not move. Neither did the statement, and that’s the more interesting fact. Set the July 29 Federal Open Market Committee (FOMC) statement beside the one issued on June 17, and the two documents are identical apart from a single verb and a paragraph at the bottom naming three dissenters.














