|

Silver Price Analysis: XAG/USD collapses more than 3%, approaches the 200-DMA

  • XAG/USD has moved downward after breaking support levels, remaining above the 200-day EMA at $22.96, which is now under pressure.
  • Oscillators such as the Relative Strength Index (RSI) and three-day Rate of Change (RoC) indicate a negative scenario for Silver.
  • If the price surpasses the May 26 low, Silver could potentially drop to the $21.00 level.
  • If buyers can push XAG/USD back above the 100-day EMA at $23.54, a challenge to $24.00 could be expected.

Silver price plunges more than 3%, and sellers are eyeing a challenge of the 200-day Exponential Moving Average (EMA), as overall US Dollar (USD) strength drives the financial markets on Tuesday. Fed speakers will cross newswires, while the Fed Chair Jerome Powell’s testimony at the US Congress dampened the market mood. At the time of writing, XAG/USD exchanges hands at $23.14 after hitting a daily high of $24.02.

XAG/USD Price Analysis: Technical outlook

The XAG/USD has shifted downward biased after cracking support levels. Yet stills above the 200-day EMA ) at $22.96, which is up for grabs, as Silver’s spot price continues to nosedive during the North American session. Oscillators like the Relative Strength Index (RSI) indicator portray a negative scenario for XAG’s buyers, with the RSI turning negative, while the three-day Rate of Change (RoC) is at its lowest level since May 25.

That said, the XAG/USD first support would be the $23.00 figure. A breach of the latter will expose the 200-day EMA, followed by the May 26 low at $22.68. if XAG/USD surpasses the latter, Silver could plummet to the $21.00 handle. Conversely, if XAG/USD buyers reclaim the 100-day EMA at $23.54, they could challenge $24.00.

XAG/USD Price Action – Daily chart
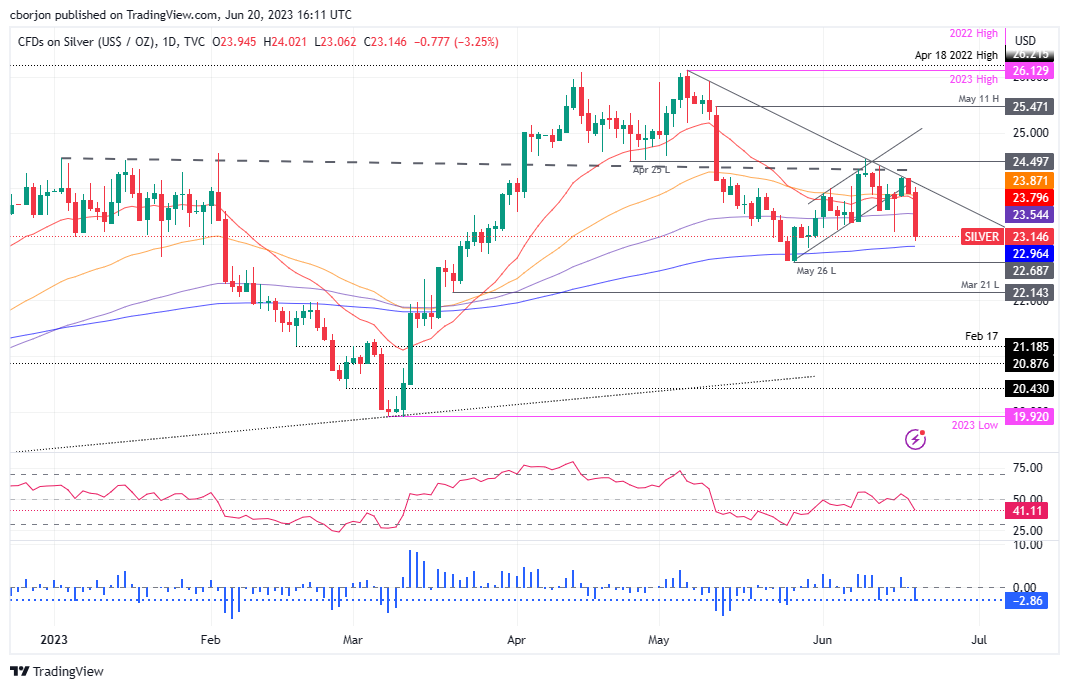
XAG/USD Daily chart

XAG/USD

Overview
Today last price23.12
Today Daily Change-0.83
Today Daily Change %-3.47
Today daily open23.95
 
Trends
Daily SMA2023.64
Daily SMA5024.41
Daily SMA10023.36
Daily SMA20022.43
 
Levels
Previous Daily High24.2
Previous Daily Low23.89
Previous Weekly High24.4
Previous Weekly Low23.22
Previous Monthly High26.14
Previous Monthly Low22.68
Daily Fibonacci 38.2%24.01
Daily Fibonacci 61.8%24.08
Daily Pivot Point S123.82
Daily Pivot Point S223.7
Daily Pivot Point S323.51
Daily Pivot Point R124.14
Daily Pivot Point R224.33
Daily Pivot Point R324.46

Author

Christian Borjon Valencia

Markets analyst, news editor, and trading instructor with over 14 years of experience across FX, commodities, US equity indices, and global macro markets.


More from Christian Borjon Valencia
Share:

Editor's Picks

AUD/USD trims losses, still near 0.6900

AUD/USD remains well on the defensive, adding to Wednesday’s pullback and trading close to the key 0.6900 contention zone ahead of the opening bell in Asia. Discouraging prints from the Australian labour market report have weighed on the Aussie, which has remained unable to take advantage from the marked pullback in the Greenback.

USD/JPY slides back below 158.00 as USD reverses post-CPI gains

USD/JPY extends the previous day's pullback from a three-week high, attracting follow-through selling and sliding below 158.00 during Thursday's Asian session. Traders remain on high alert amid speculation that authorities will step in to prop up the Japanese Yen. The US Dollar, meanwhile, reverses Wednesday's hot CPI-led gains to April 2025 highs as US bond yields retreat on China bond-buying talk, further pressuring the pair.

Gold: Upside remains capped by $4,200

Gold regains the smile and leaves behind three consecutive days of losses, advancing to the $4,170 region per troy ounce on Thursday. The precious metal’s recovery comes amid the fresh offered stance in the Greenback and declining US Treasury yields while investors remain cautious ahead of the Fed’s Warsh speech on Friday.

Bitcoin rebounds to $82,000 as PPI hits 6.3%, nearly $1B liquidated
Bitcoin (BTC) recovered near $82,000 on Thursday after briefly falling below $80,000, paring losses triggered by hotter-than-expected US inflation data. September PPI inflation rose 6.3% YoY, exceeding forecasts of 5.3% and marking its second-highest level since November 2022. Core PPI inflation climbed to 5% annually, above expectations of 4.4%.
The Iran war will eventually end. Tariffs won't. Here's the problem
Two cost shocks are in the September Consumer Price Index (CPI), and they have different half-lives. Energy is up 20.4% on the year and accounts for about 1.3 points of the 3.7% headline, and that shock reverses when Oil does: Brent was back at its pre-war price on July 1 and above $100 again by the end of the month, after the ceasefire collapsed on July 8.
Everyone's dumping Gold after hot US inflation. Here's why $4,100 could be a floor, not a cliff
Gold (XAU/USD) is recovering from a sharp sell-off triggered by hotter-than-expected United States (US) inflation data released on Wednesday. The precious metal briefly plunged toward $4,073 as investors increased their bets on further Federal Reserve (Fed) interest rate hikes before recovering as US Treasury yields and the US Dollar (USD) reversed their initial gains.















