|

Silver Price Analysis: Declining in a falling channel

  • Silver is weakening within a descending channel. 
  • The channel is more likely than not to continue unfolding lower. 
  • A break below the June 13 low would confirm further downside. 

Silver (XAG/USD) looks like it has started to form a descending channel on the 4-hour chart and the evidence is building to argue that it is probably in a short-term downtrend now too. Given the old saying that “the trend is your friend” the odds probably favor  a continuation lower – with some important caveats. 

Silver 4-hour Chart 


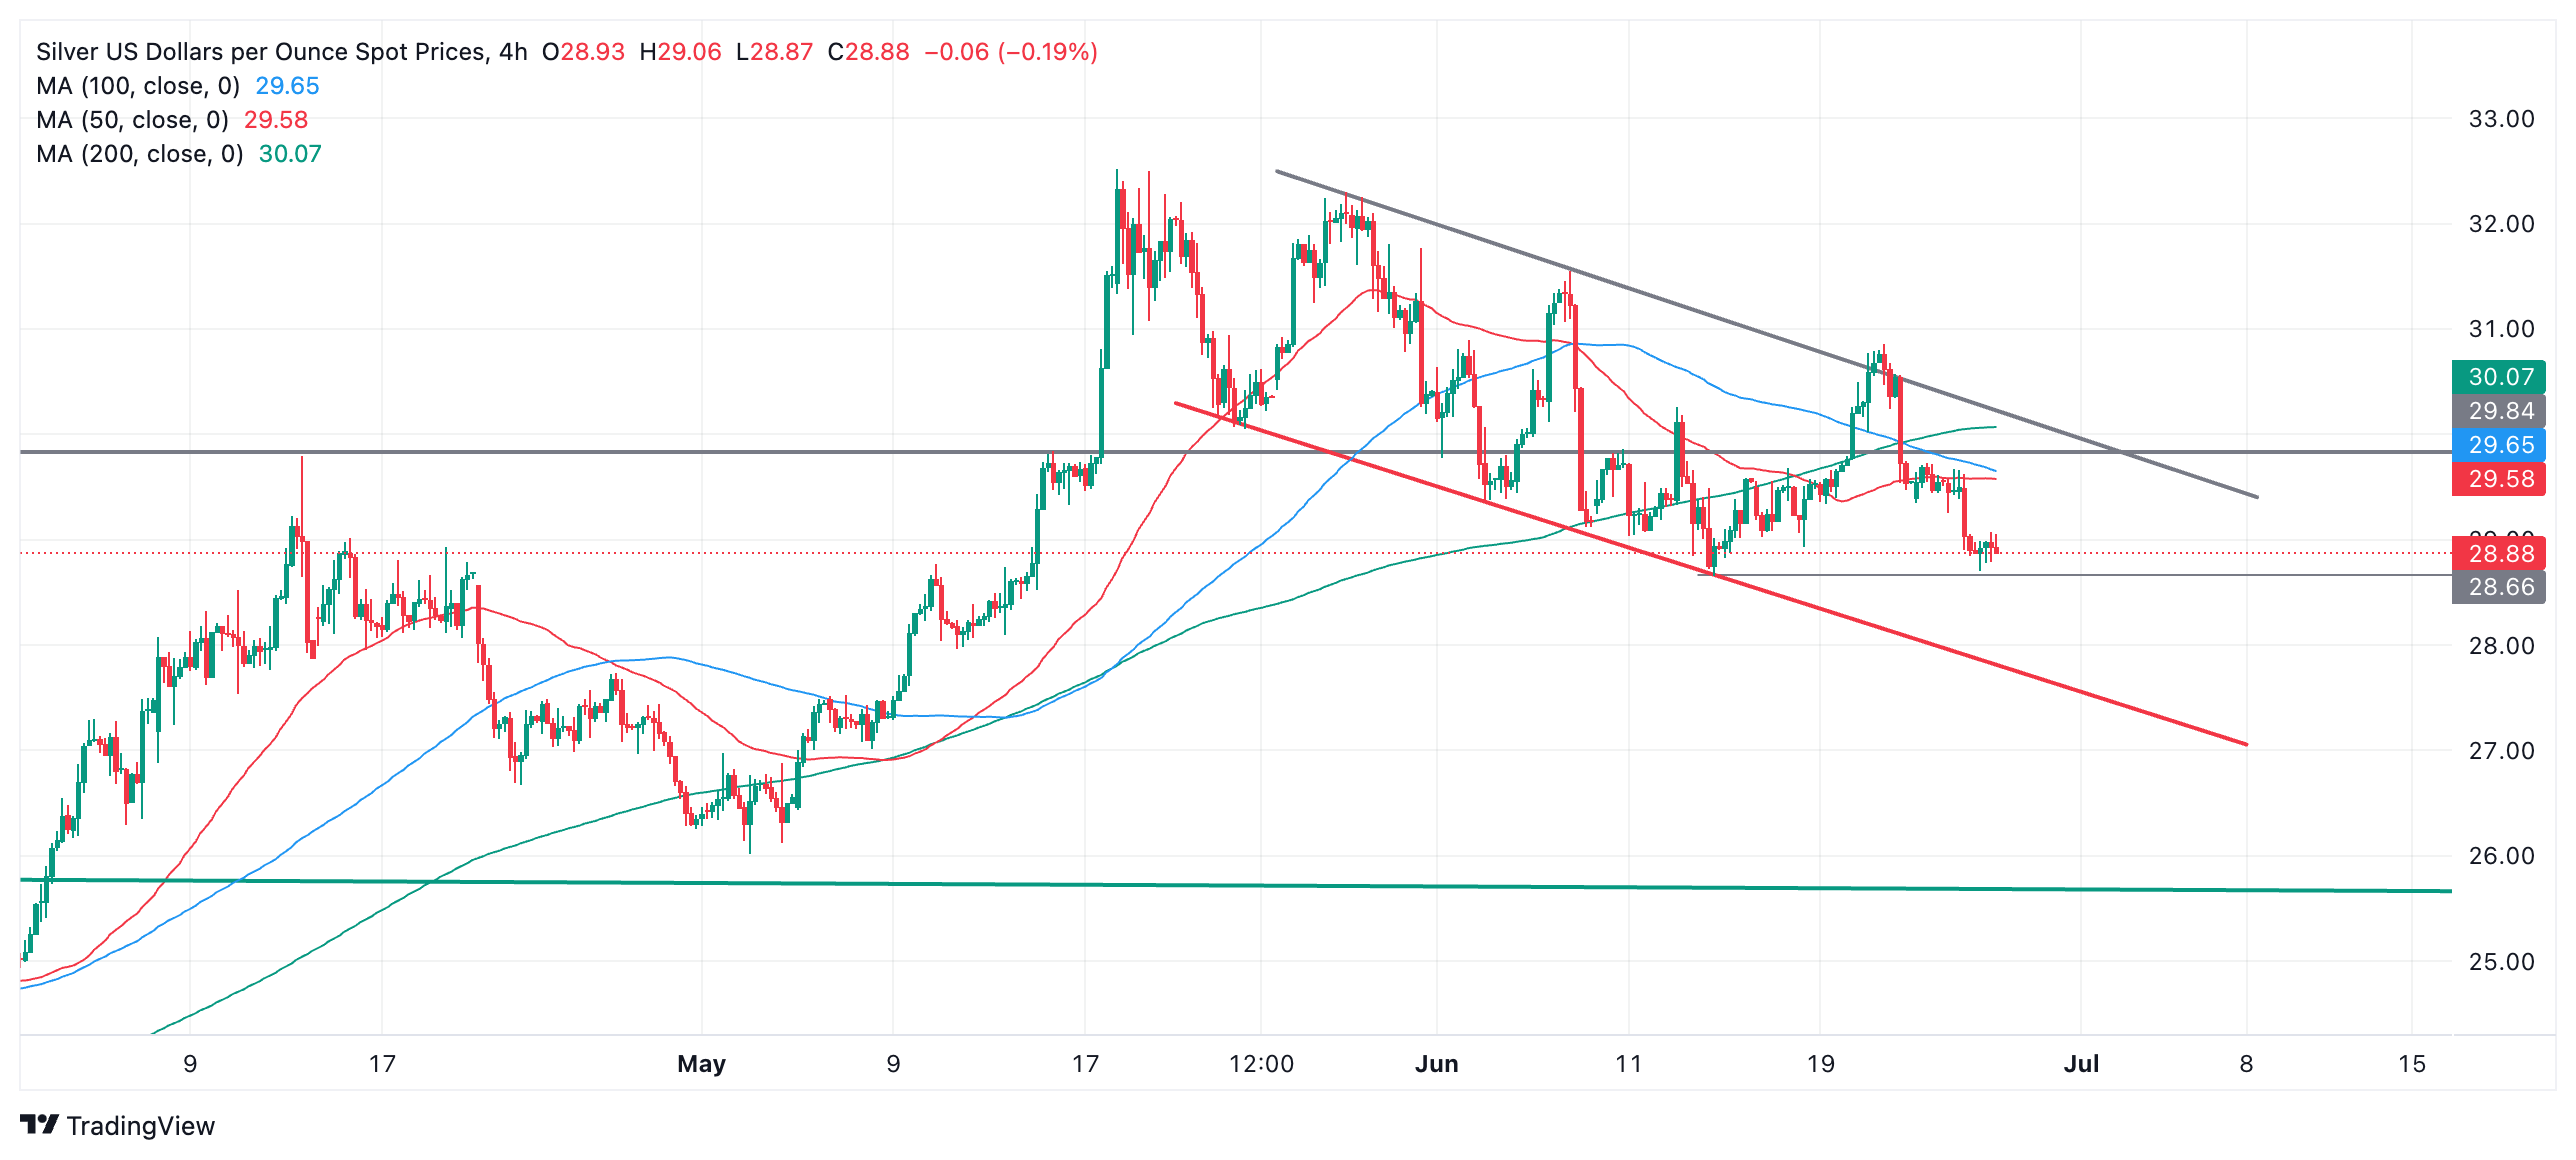
Silver rallied strongly on June 20 and 21 but then failed to break out of the top of its falling channel. It then fell back down, finding support at $28.66, the June 13 lows, from where it has just bounced. 

If Silver breaks below $28.66 it will confirm it is in a short-term downtrend and probably continue to decline substantially lower. The next downside target likely lies at the level of the lower channel line, at around $27.50. 

The caveat is that Silver did temporarily break out of its channel on June 21, and although it failed to follow-through higher the fact it breached the channel’s upper borderline suggests the integrity of the falling channel has been compromised. This will make it easier for price to break out higher on a second attempt. 

If the June 13 lows hold, therefore, and Silver starts to recover it could run back up to the level of the upper channel line at around $29.90, which is also a major resistance level at the top of Silver’s four-year consolidation zone. A decisive break above that level would indicate a major turning point for the precious metal and suggest a new uptrend was probably evolving. 

A decisive break would be one accompanied by a long green up candle that broke clearly above the level and closed near its high or three green candles in a row that broke above the level. 

Author

Joaquin Monfort

Joaquin Monfort is a financial writer and analyst with over 10 years experience writing about financial markets and alt data. He holds a degree in Anthropology from London University and a Diploma in Technical analysis.

More from Joaquin Monfort
Share:

Editor's Picks

GBP/USD appears well offered near 1.3160

GBP/USD builds on Tuesday’s losses, although it now manages to pick up some pace and bounce off earlier multi-month troughs near 1.3140. The Greenback’s solid performance and continued political turmoil in the UK are keeping Cable under persistent pressure, with little sign of a meaningful recovery.

EUR/USD trims losses, hovers around 1.1350

EUR/USD now regains some composure and rebounds to the 1.1350 zone on Wednesday, partially reversing the prior pullback to fresh yearly lows near 1.1320. Meanwhile, spot remains on the back foot as the US Dollar continues to draw support from hawkish Fed expectations and uncertainty over the outcome of US-Iran peace negotiations.

Gold pressured near fresh 2026 lows

Gold accelerates its decline and gyrates around the key $4,000 mark per troy ounce on Wednesday, its lowest level since November 2025. In the meantime, tighter-for-longer Fed expectations and a broadly firmer US Dollar continue to weigh on the yellow metal, while uncertainty surrounding a potential US-Iran peace agreement has done little to revive demand for the safe haven space.

Crypto Today: Bitcoin, Ethereum, XRP trade under pressure as September Fed rate-hike odds increase

Bitcoin is trading between $62,000 and $63,000 at the time of writing on Wednesday, weighed down by headwinds stemming from macroeconomic uncertainty and geopolitical tensions in the Middle East.

US-Iran talks: The next 60 days will decide where Oil prices go next
Oil markets received some encouraging news after weeks of rising tensions in the Middle East. But let’s not get ahead of ourselves: we’re far from victory, and markets just seem to have priced out the worst-case scenario. The US and Iran have reportedly made "substantive progress" in talks in Switzerland and agreed on a framework for working toward a broader deal within 60 days.
Regime change: Inside Kevin Warsh's first move to make the Fed unreadable on purpose

The rate did not move. That was the least interesting thing about Kevin Warsh's first meeting in charge of the Fed. The FOMC held its benchmark at 3.50%-3.75% for the fourth straight meeting, exactly as priced, and then the new chair used his first press conference to dismantle the machinery the market has leaned on for a decade.