Shanghai Composite Index Elliott Wave technical analysis [Video]
![Shanghai Composite Index Elliott Wave technical analysis [Video]](https://editorial.fxsstatic.com/images/i/charts-01_XtraLarge.jpg)
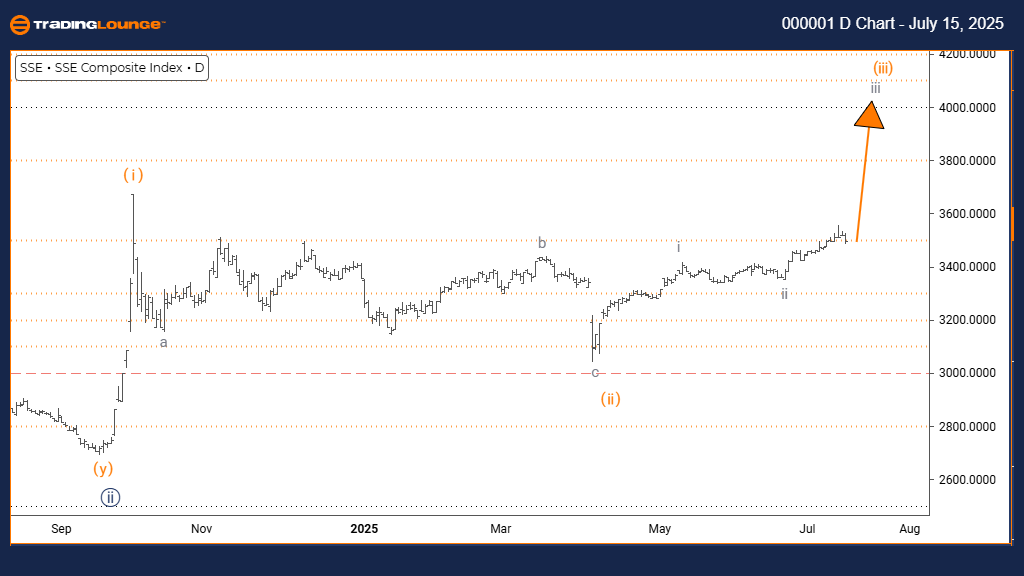
Shanghai Composite Elliott Wave analysis – Day chart
Function: Bullish Trend.
Mode: Impulsive.
Structure: Gray Wave 3.
Position: Orange Wave 3.
Direction next higher degrees: Gray Wave 3 (Started).
Details: Gray Wave 2 is complete; Gray Wave 3 is now active.
The daily Elliott Wave analysis of the Shanghai Composite shows a clear bullish trend. Price action is impulsive, with Gray Wave 3 forming within the structure of Orange Wave 3. This suggests the index is entering a strong upward phase.
Technical analysis confirms that Gray Wave 2 has ended, and the current move has transitioned into Gray Wave 3. This wave is typically the longest and strongest in an Elliott sequence, often associated with increased buying pressure and higher trading volume.
With Orange Wave 3 in progress, this setup indicates the beginning of a major upward push. The current momentum suggests the Shanghai Composite may continue its rise, offering favorable conditions for bullish trades.
Traders are advised to monitor this wave for continued strength, as third waves often deliver extended price movements. The daily chart analysis supports a bullish outlook, with room for further gains before any major correction occurs.
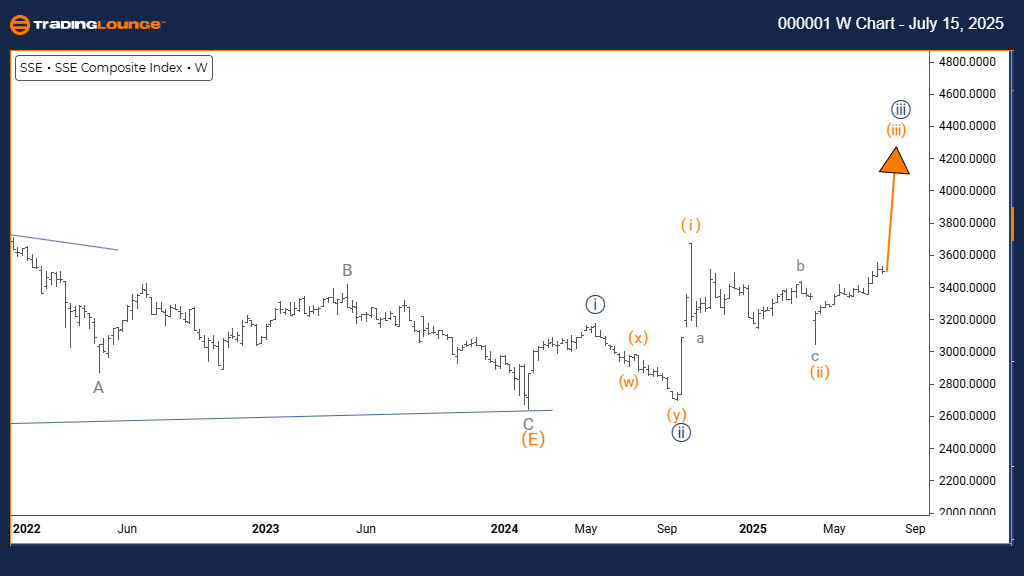
Shanghai Composite Elliott Wave analysis – Weekly chart
Function: Bullish Trend.
Mode: Impulsive.
Structure: Orange Wave 3.
Position: Navy Blue Wave 3.
Direction next lower degrees: Orange Wave 4.
Details: Orange Wave 2 is complete; Orange Wave 3 of 3 is now in play.
The weekly Elliott Wave analysis for the Shanghai Composite highlights a strong upward trend. The index is currently in Orange Wave 3 of Navy Blue Wave 3—usually the most dynamic phase in an Elliott sequence.
Technical indicators confirm that Orange Wave 2 has ended. Now, Orange Wave 3 is underway, suggesting strong institutional buying and continued upward price momentum. The current positioning implies this could be the most aggressive part of the uptrend.
As Orange Wave 3 unfolds, the next step is Orange Wave 4, a minor correction expected after the current move. Until then, the bullish trend is likely to continue gaining strength.
This analysis helps traders recognize the index’s strong positioning within its broader trend cycle. Orange Wave 3 of 3 typically produces sharp gains and offers high-probability setups for trend-following strategies. The bullish structure is intact, with the upward momentum supported across multiple timeframes.
Shanghai Composite Index Elliott Wave technical analysis [Video]
Author

Peter Mathers
TradingLounge
Peter Mathers started actively trading in 1982. He began his career at Hoei and Shoin, a Japanese futures trading company.


