Shanghai Composite Index Elliott Wave technical analysis [Video]
![Shanghai Composite Index Elliott Wave technical analysis [Video]](https://editorial.fxsstatic.com/images/i/nvidia-01_XtraLarge.jpg)
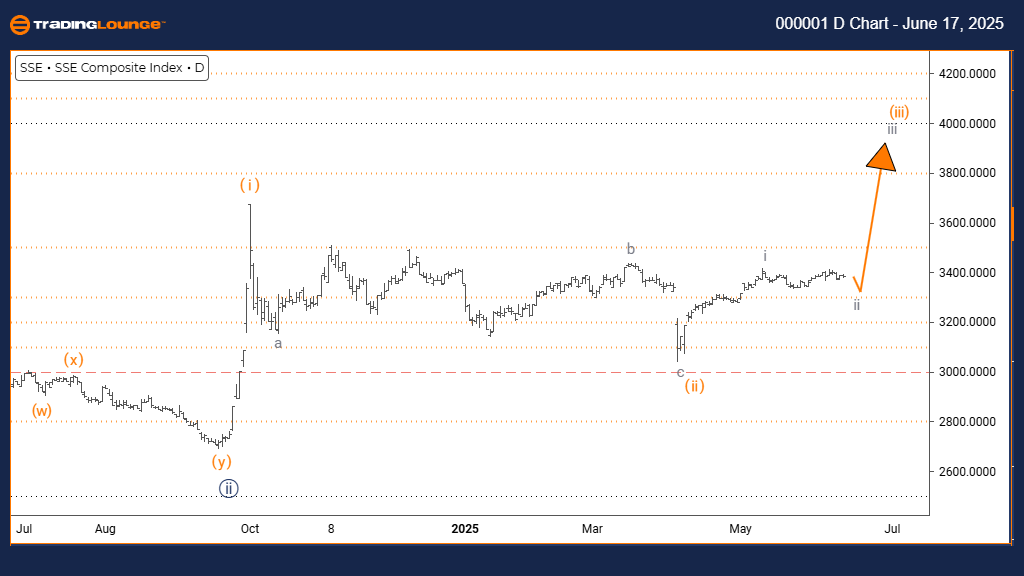
Shanghai Composite Elliott Wave technical analysis
Function: Counter Trend.
Mode: Corrective.
Structure: Gray Wave 2.
Position: Orange Wave 3.
Direction next higher degrees: Gray Wave 3.
Details: Gray wave 1 appears complete; gray wave 2 is currently active.
The Shanghai Composite day chart Elliott Wave analysis outlines a counter-trend structure. The current price action is corrective, indicating a retracement phase within a broader upward trend. Gray wave 2 is unfolding within orange wave 3, suggesting a typical pullback before continuation.
With gray wave 1 concluded, gray wave 2 represents a corrective segment that often partially retraces prior movement. Once gray wave 2 finishes, gray wave 3 is expected to resume the primary trend direction.
The setup indicates the index is moving through gray wave 2 after completing gray wave 1. This typically leads to range-bound trading or moderate pullbacks. Being positioned within orange wave 3 confirms the broader wave sequence is still progressing.
Traders should monitor gray wave 2 for signs of completion. The counter-trend nature of the wave suggests temporary consolidation before a potential breakout into gray wave 3.
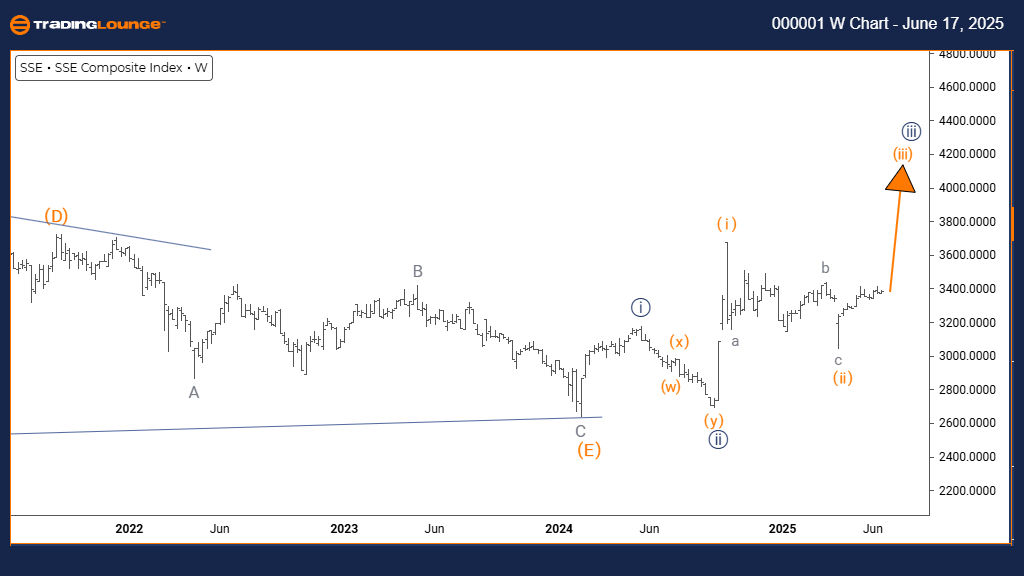
Shanghai Composite Elliott Wave technical analysis
Function: Bullish Trend.
Mode: Impulsive.
Structure: Orange Wave 3.
Position: Navy Blue Wave 3.
Direction next higher degrees: Orange Wave 3 (Started).
Details: Orange wave 2 appears complete; orange wave 3 of 3 is now active.
The weekly Elliott Wave analysis for the Shanghai Composite shows a bullish trend. Price action is currently impulsive, with orange wave 3 unfolding within navy blue wave 3. This pattern indicates the index is in a strong bullish phase, often associated with extended upward movement.
Orange wave 2 has likely ended its correction, transitioning into orange wave 3. This wave generally delivers the most significant price movement in an Elliott Wave cycle. As wave 3 continues developing, it is likely to generate robust upward pressure.
The technical setup now suggests the Shanghai Composite is poised for potentially large gains. With orange wave 3 in progress, buyers appear active and in control, supporting sustained bullish momentum in the near term.
Shanghai Composite Elliott Wave technical analysis [Video]
Author

Peter Mathers
TradingLounge
Peter Mathers started actively trading in 1982. He began his career at Hoei and Shoin, a Japanese futures trading company.


