Russell 2000 index Elliott Wave technical analysis [Video]
![Russell 2000 index Elliott Wave technical analysis [Video]](https://editorial.fxstreet.com/images/Markets/Equities/FTSE/ftse-100-index-17327640.jpg)
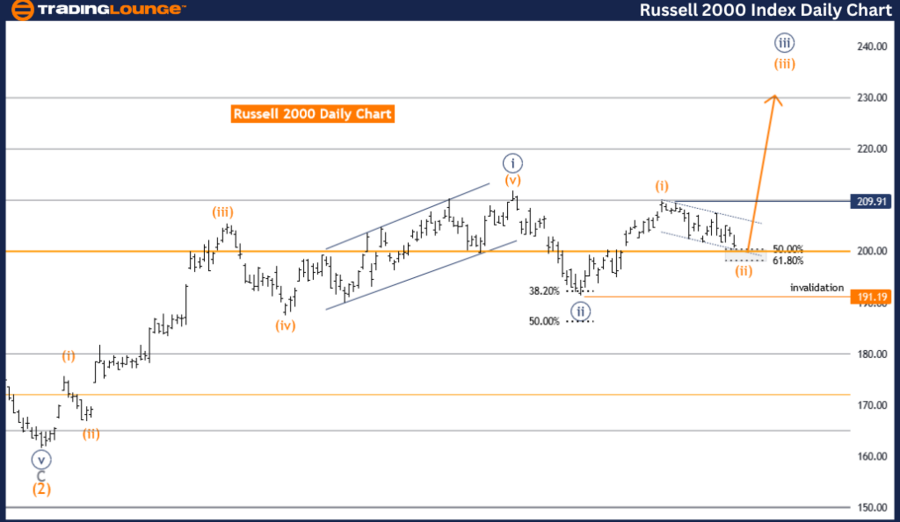
RUSSELL 2000 Elliott Wave Analysis Trading Lounge Day Chart,
Russell 2000 Elliott Wave technical analysis
Function: Trend.
Mode: Corrective.
Structure: Orange Wave 2.
Position: Navy Blue Wave 3.
Direction next higher degrees: Orange Wave 3.
Details: Orange Wave 2 still is in play and looking near to end.
Wave cancel invalid level: 191.19.
The Russell 2000 Elliott Wave analysis on the daily chart indicates a trending market that is currently in a corrective mode. This means that although the primary trend is intact, the market is undergoing a temporary retracement or correction. The structure of this correction is identified as orange wave 2, which is positioned within navy blue wave 3. This setup indicates an intermediate corrective phase within a larger upward trend.
The current focus is on orange wave 2, which remains active and appears to be nearing its completion. This phase of correction suggests that the market is in the process of consolidating before potentially resuming its primary trend direction. The analysis implies that once orange wave 2 concludes, the market is expected to begin orange wave 3, which would likely signify a return to a more robust upward movement in alignment with the primary trend.
The direction for the next higher degrees points to the anticipated onset of orange wave 3 following the completion of orange wave 2. Orange wave 3 typically represents a strong impulsive move in the direction of the main trend, suggesting a significant upward momentum once the correction phase is over.
A critical aspect of this analysis is the wave cancel invalid level, set at 191.19. This level serves as a benchmark to validate the current wave count. If the market price drops below this level, it would invalidate the existing wave structure, necessitating a reevaluation of the Elliott Wave analysis and potentially changing the expected market direction.
In summary, the Russell 2000 daily chart analysis highlights a trending market currently undergoing a corrective phase identified as orange wave 2 within navy blue wave 3. The ongoing correction appears to be nearing its end, with expectations for the market to resume its upward trend with the initiation of orange wave 3. The wave cancel invalid level at 191.19 is crucial for maintaining the accuracy of the current wave count. This analysis provides insight into the current corrective phase, helping traders anticipate potential market movements and make informed trading decisions based on the expected continuation of the trend.
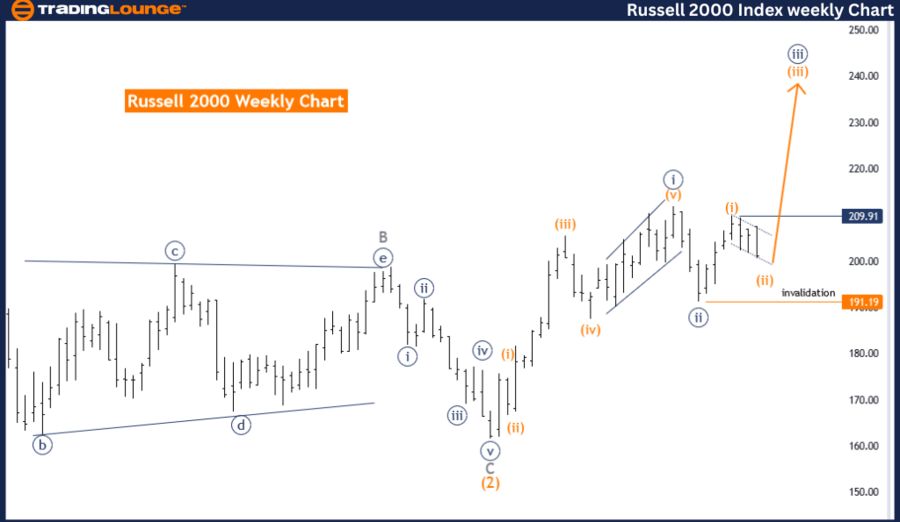
RUSSELL 2000 Elliott Wave Analysis Trading Lounge Weekly Chart,
Russell 2000 Elliott Wave technical analysis
FUNCTION: Trend.
MODE: corrective.
STRUCTURE: orange wave 2.
POSITION: navy blue wave 3.
DIRECTION NEXT HIGHER DEGREES: orange wave 3.
DETAILS:orange wave 2 still is in play and looking near to end.
Wave Cancel invalid level:191.19.
The Russell 2000 Elliott Wave analysis on the weekly chart indicates the market is in a corrective phase within an overall upward trend. The analysis identifies the current corrective structure as orange wave 2, which is positioned within the larger navy blue wave 3. This setup suggests that the market is in the midst of a temporary pullback within a broader uptrend.
The focus of the analysis is on the ongoing orange wave 2, which remains active and appears to be approaching its completion. This implies that the market is consolidating and preparing for the next significant move. Once orange wave 2 is finished, the market is expected to start orange wave 3, which typically represents a strong impulsive move in the direction of the primary trend.
The direction for the next higher degrees points to the beginning of orange wave 3 following the completion of orange wave 2. Orange wave 3 is generally characterized by a strong upward movement, indicating that the market may experience a robust increase once the corrective phase concludes.
A key aspect of this analysis is the wave cancel invalid level, set at 191.19. This level is critical for maintaining the validity of the current wave structure. If the market price falls below this level, it would invalidate the existing wave count, requiring a reassessment of the Elliott Wave analysis and potentially altering the expected market direction.
In summary, the Russell 2000 weekly chart analysis shows a market in a corrective phase within a larger upward trend. The ongoing orange wave 2 is nearing its end, with expectations for the market to resume its upward trend with the start of orange wave 3. The wave cancel invalid level at 191.19 is essential for the accuracy of the current wave count. This analysis provides insights into the current market correction, helping traders anticipate future movements and make informed trading decisions based on the expected continuation of the trend.
Technical analyst: Malik Awais.
Russell 2000 Elliott Wave technical analysis [Video]
Author

Peter Mathers
TradingLounge
Peter Mathers started actively trading in 1982. He began his career at Hoei and Shoin, a Japanese futures trading company.


