Royal Gold Inc (NASDAQ: RGLD), forecasting Gold path higher into $6,000.00 [Video]
![Royal Gold Inc (NASDAQ: RGLD), forecasting Gold path higher into $6,000.00 [Video]](https://editorial.fxsstatic.com/images/i/gold-03.jpg)
Royal Gold Inc. (NASDAQ: RGLD) is a leading precious metals company that specializes in royalty and streaming financing within the mining sector. Founded in 1981 and headquartered in Denver, Colorado, the company does not operate mines directly. Instead, it provides upfront capital to mining companies in exchange for the right to receive a percentage of the revenue (royalties). Alternatively, it can purchase metal at a fixed, discounted price (streams). This business model allows Royal Gold to benefit from rising gold prices. At the same time, it can minimize the operational risks typically associated with mining activities, such as cost overruns and production disruptions.
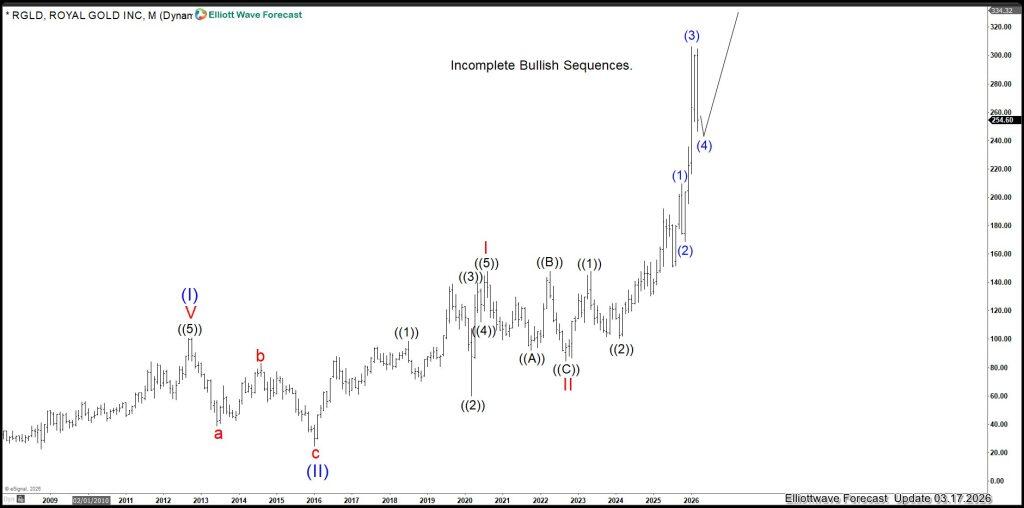
The long-term price chart of Royal Gold Inc. (RGLD) illustrates a strong bullish trend characterized by a series of impulsive and corrective waves, consistent with Elliott Wave theory. From the early 2000s to 2026, the stock demonstrates a clear upward trajectory, with major impulsive phases (labeled I, III, and the current developing sequence) reflecting periods of strong appreciation. Corrective phases (such as wave II and intermediate ABC structures) indicate temporary pullbacks driven by broader market conditions or gold price fluctuations. Notably, the most recent price action shows an “incomplete bullish sequence,” suggesting that the current upward trend may continue. This reinforces the idea that RGLD behaves as a leveraged proxy for gold, where sustained increases in gold prices tend to amplify gains in the company’s stock, albeit with intermittent corrections influenced by equity market dynamics and company-specific factors. Please check the chart below.
Royal Gold (RGLD) monthly Elliott Wave chart
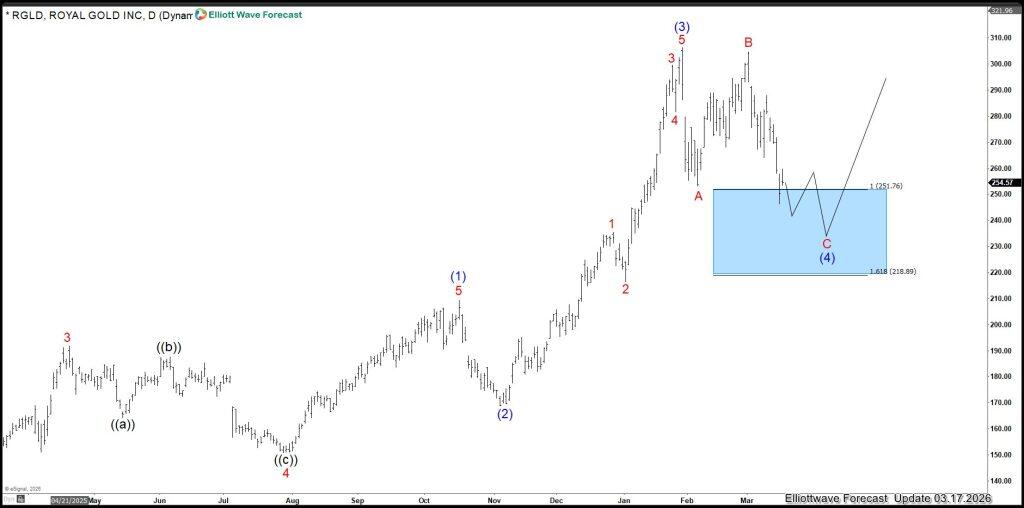
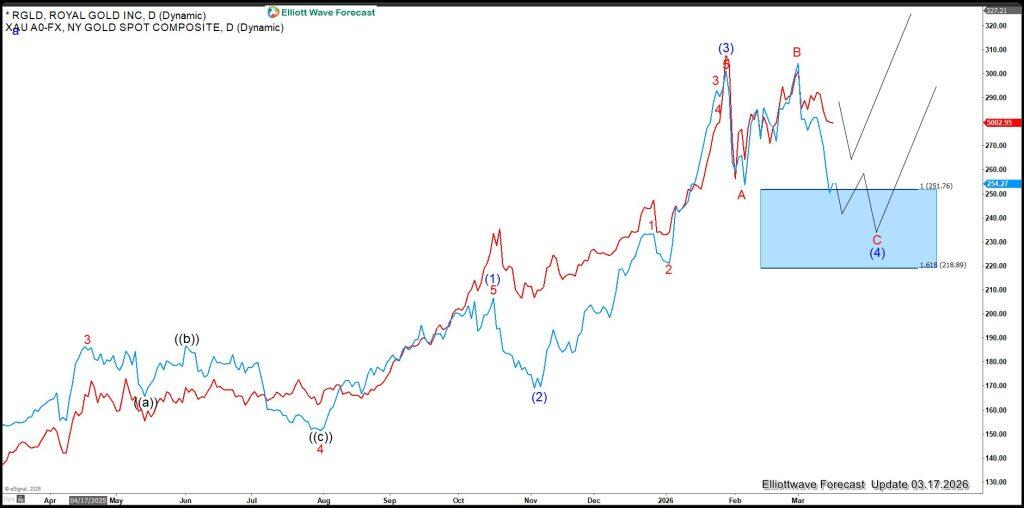
The daily chart of Royal Gold Inc. (RGLD) offers a refined perspective on the prevailing market structure and underscores the presence of a corrective phase within a broader bullish trend. Following the completion of a strong impulsive rally to the upside, labeled as wave (3), the stock has transitioned into a corrective sequence identified as wave (4). This correction unfolds through an A–B–C structure, with prices currently moving lower toward a defined support region highlighted by the blue box.
The blue box represents a high-probability demand zone, derived from Fibonacci retracement and extension levels, approximately between 251 and 218 USD. Within Elliott Wave analysis, wave (4) corrections frequently retrace a portion of wave (3) before the dominant trend resumes. This zone is therefore regarded as a potential reversal area, where renewed buying interest is expected to emerge.
The importance of this support region extends beyond RGLD itself. The company’s performance is closely correlated with gold (XAUUSD). This means stabilization and a bullish reaction from this area would suggest continued strength in underlying fundamentals, particularly gold prices. If RGLD finds support and resumes its upward trajectory from the blue box, it reinforces expectations of sustained momentum in gold.
Short-term volatility remains possible within the blue box. A temporary bounce followed by a final dip toward point C would be consistent with corrective wave behavior. Once this sequence concludes, the next impulsive advance, wave (5), is anticipated to drive prices higher, potentially surpassing prior peaks. Such a move in RGLD would likely coincide with a broader upward trend in gold.
In conclusion, the blue box functions as a critical technical support zone. A bullish response from this area would confirm the continuation of RGLD’s upward trend and simultaneously strengthen the outlook for gold, given the strong linkage between the company’s trajectory and the commodity’s value. Please review the chart below.
Royal Gold (RGLD) daily Elliott Wave chart
The combined quarterly chart of gold (XAUUSD) and Royal Gold Inc. (RGLD) provides strong visual evidence of a positive long-term correlation between the two assets. Over multiple decades, both series exhibit a similar directional trend, particularly during major bullish cycles. For instance, during periods of rising gold prices—such as the 2000–2011 bull market and the more recent uptrend into 2025—RGLD’s stock price also increases significantly. This reflects the company’s direct exposure to gold revenues through its royalty and streaming business model.
However, the chart also highlights that the correlation is not perfectly linear. RGLD (blue line) often shows greater volatility and sharper price swings compared to gold (red line). In several periods, the stock either outperforms or underperforms gold, indicating a leveraged response. This is typical of gold-related equities, where operational leverage, investor sentiment, and equity market conditions amplify movements relative to the underlying commodity.
Notably, in the most recent period, gold has experienced a very strong upward acceleration. The yellow metal reaches new highs, while RGLD has also risen but at a comparatively slower pace. This slight divergence suggests that, although gold remains the primary driver, stock-specific factors—such as market expectations, capital allocation, or temporary corrections (as seen in the daily chart)—can cause short-term deviations. Here is the Quarterly of Royal Gold Inc and Gold, showing the strong correclation.
Overlay of Royal Gold and XAU/USD (Spot Gold)
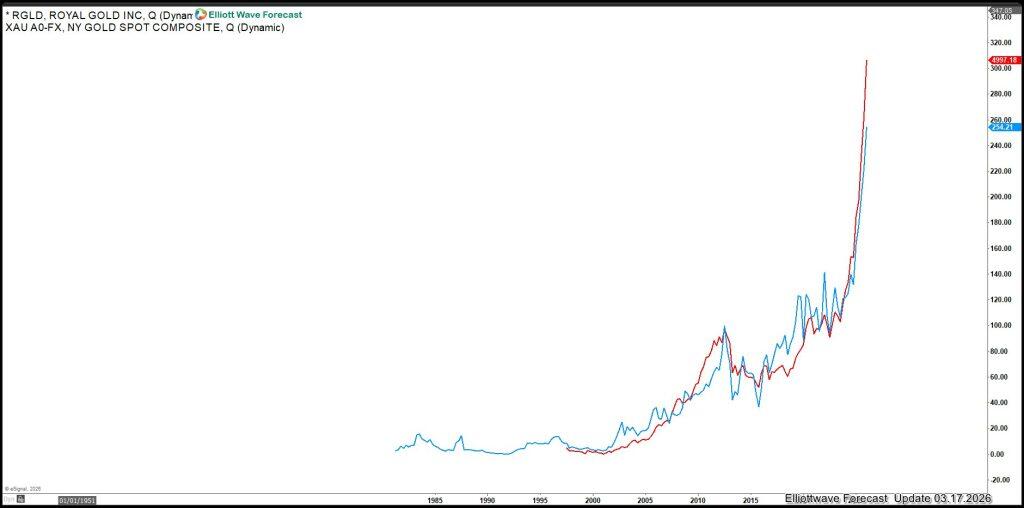
Overall, the chart confirms that RGLD and gold share a strong positive correlation over the long term, with RGLD acting as a leveraged proxy for gold prices. When gold enters sustained bullish phases, RGLD tends to follow and often magnify those movements, reinforcing the fundamental link between the company’s performance and the value of gold. Daily chart showing Royal Gold Inc and Gold getting closer to a turn higher.
In conclusion, both Royal Gold Inc. (RGLD) and gold (XAUUSD) appear to be undergoing a wave (4) corrective phase within a broader bullish cycle. The identification of a high-frequency “Blue Box” support zone in RGLD highlights a statistically significant area. This is the area where corrective structures—typically unfolding in 3, 7, or 11 swings—tend to terminate. According to Elliott Wave Forecast methodology, these zones represent regions where institutional participants often re-enter the market.
Author

Elliott Wave Forecast Team
ElliottWave-Forecast.com


