|

Pan American Silver (PAAS) correcting in a flat structure

Pan American Silver (PAAS) continues to extend lower and it looks like the stock is correcting in a flat structure as the second daily chart below shows. The stock is a good representation for the silver mining sector. Although it has been pretty tough lately for mining sector generally (both gold and silver miners), a turn higher might be due soon.

PAAS monthly Elliott Wave chart

PAAS

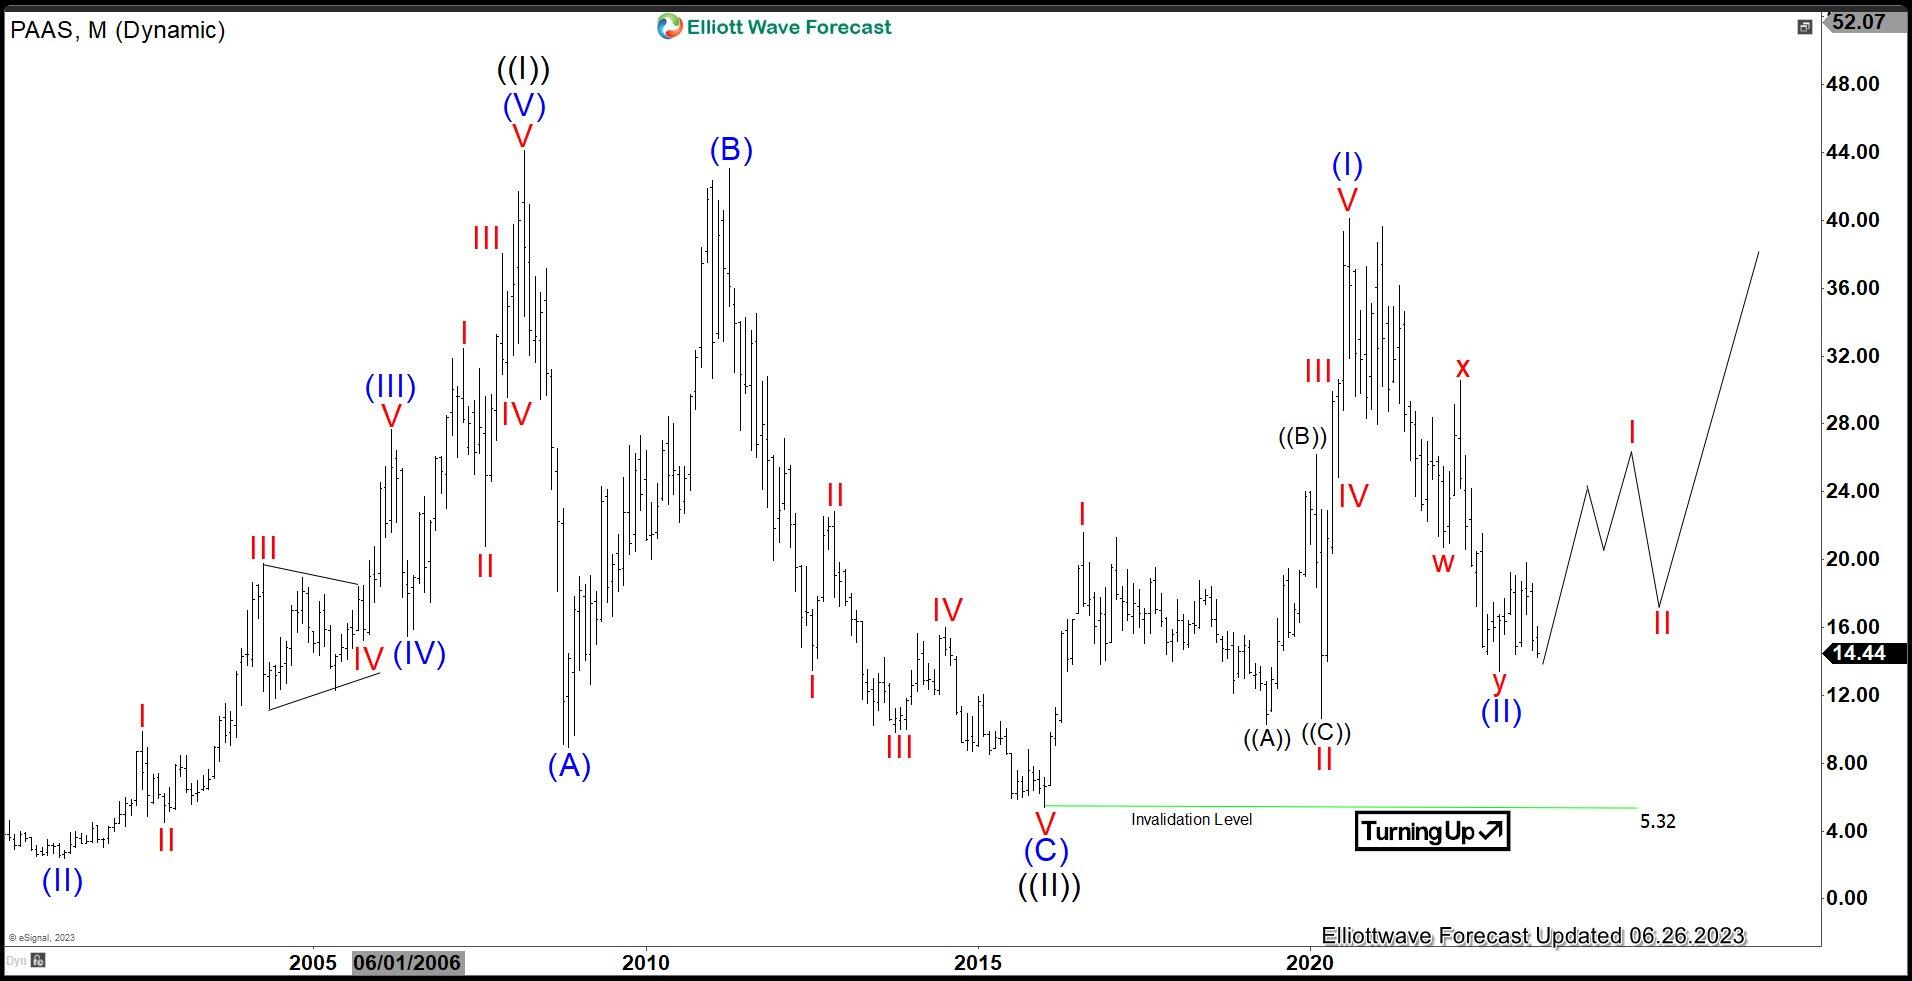
Monthly chart of PAAS above shows the stock made important major low in 2016 at 5.32. Since then, it has rallied higher in 5 waves and ended wave (I) at 40.11. Pullback in wave (II) ended at 13.40 with internal subdivision as a double three. Down from wave (I), wave w ended at 20.73, rally in wave x ended at 30.56, and wave y lower ended at 13.40 which completed wave (II). At this stage, it’s possible that the stock is correcting this rally from 13.40 low as the daily chart below shows as an expanded flat, and while the pivot at 13.4 low holds, it can rally higher again.

PAAS daily Elliott Wave chart

PAAS

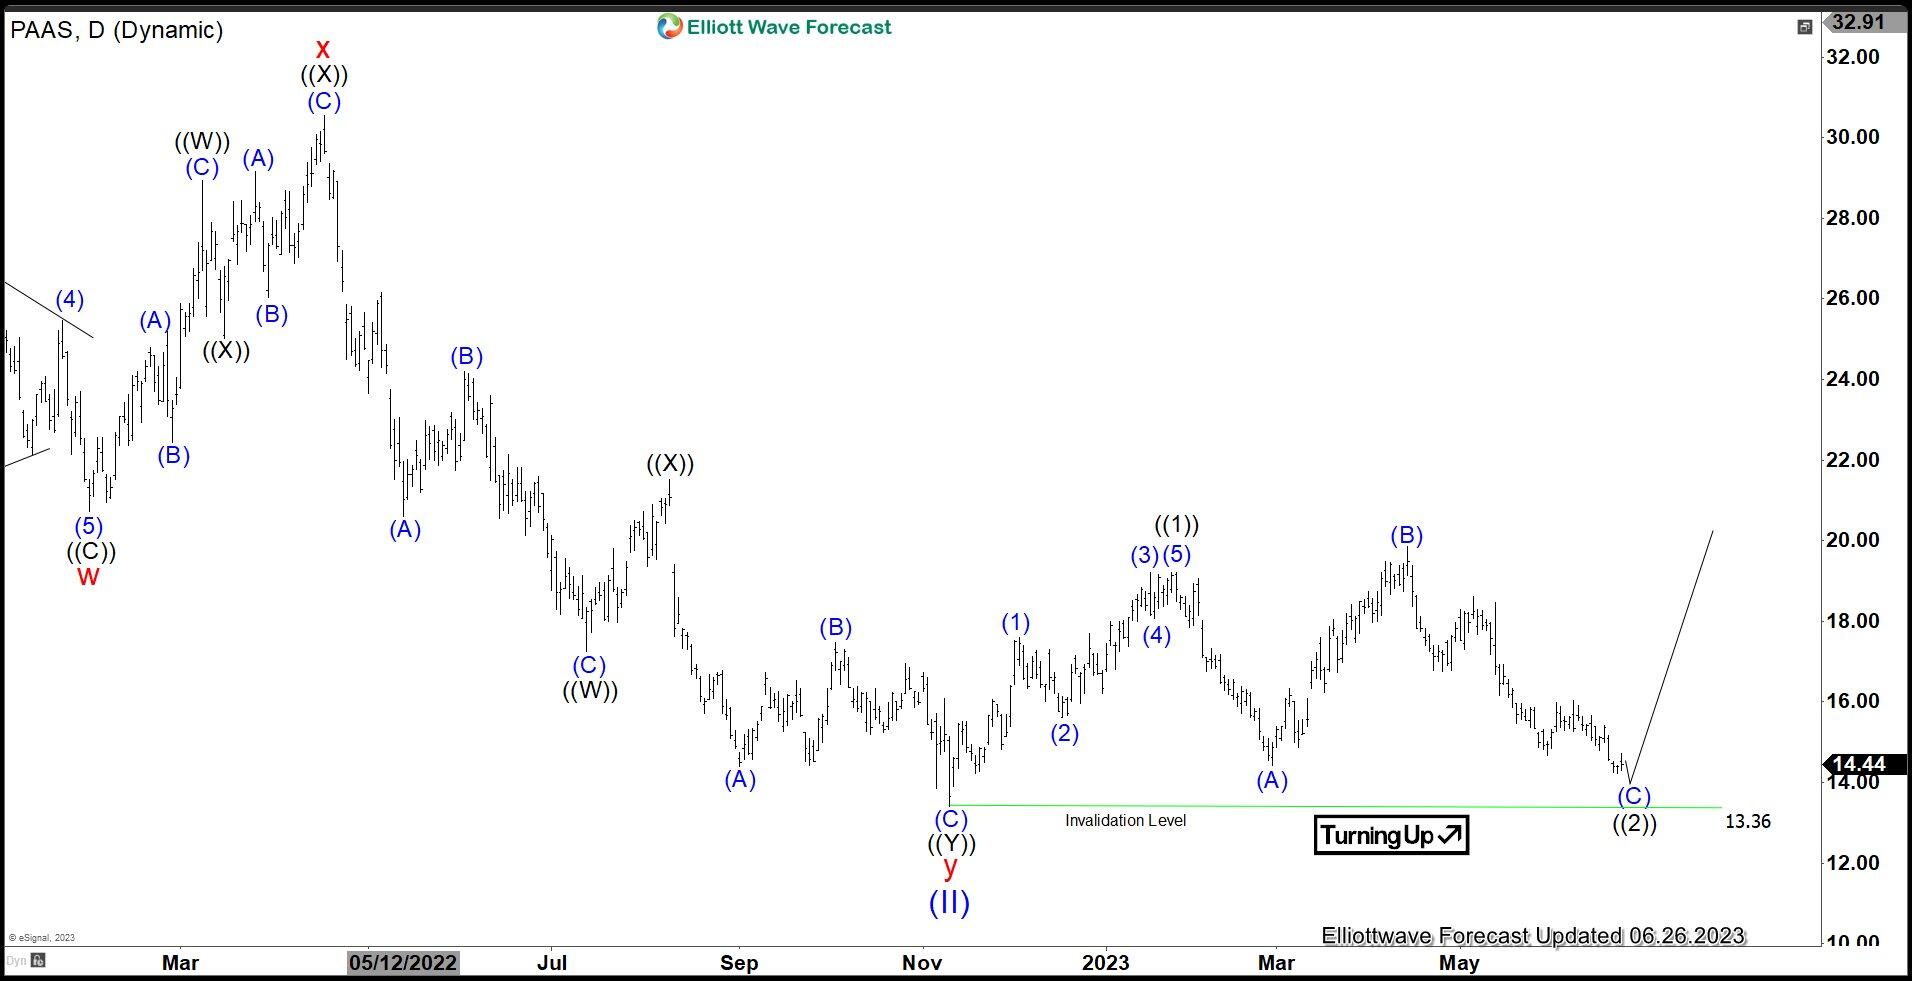
Daily Chart of Pan America Silver (PAAS) above suggests a truncated higher high (bullish sequence) from wave (II) at 13.4 low. The first leg of the rally ended wave ((1)) as 5 waves at 19.22. It then pullback and made a marginal high above 19.22 with a divergence. Afterwards, the stock turns lower in what looks to be a 5 waves down. Due to the structure of the rally from 13.4 low (i.e. a higher high with divergence), there’s a possibility that the current pullback is an expanded flat and while it stays above 13.36, then it can rally again.

Author

Elliott Wave Forecast Team

Elliott Wave Forecast Team

ElliottWave-Forecast.com

More from Elliott Wave Forecast Team
Share:

Editor's Picks

EUR/USD bounces off lows, back to 1.1860

EUR/USD now manages to regain some balance, retesting the 1.1860-1.1870 band after bottoming out near 1.1830 following the US NFP data on Wednesday. The pair, in the meantime, remains on the defensive amid fresh upside traction surrounding the US Dollar.

GBP/USD rebounds to 1.3660, USD loses momentum

GBP/USD trades with decent gains in the 1.3660 region, regaining composure following the post-NFP knee-jerk toward the 1.3600 zone on Wednesday. Cable, in the meantime, should now shift its attention to key UK data due on Thursday, including preliminary GDP gauges.

Gold stays bid, still below $5,100

Gold keeps the bid tone well in place on Wednesday, retargeting the $5,100 zone per troy ounce on the back of humble gains in the US Dollar and firm US Treasury yields across the curve. Moving forward, the yellow metal’s next test will come from the release of US CPI figures on Friday.

Ripple Price Forecast: XRP sell-side pressure intensifies despite surge in addresses transacting on-chain 

Ripple (XRP) is edging lower around $1.36 at the time of writing on Wednesday, weighed down by low retail interest and macroeconomic uncertainty, which is accelerating risk-off sentiment.

US jobs data surprises to the upside, boosts stocks but pushes back Fed rate cut expectations

This was an unusual payrolls report for two reasons. Firstly, because it was released on  Wednesday, and secondly, because it included the 2025 revisions alongside the January NFP figure.

XRP sell-off deepens amid weak retail interest, risk-off sentiment

Ripple (XRP) is edging lower around $1.36 at the time of writing on Wednesday, weighed down by low retail interest and macroeconomic uncertainty, which is accelerating risk-off sentiment.