|

Oil Price Analysis: WTI trades in three-week’s highs near $26.50 a barrel

  • Oil is well supported after Trump gives hope for a Saudi-Russian deal. 
  • The level to beat for buyers is the 28.00 resistance.
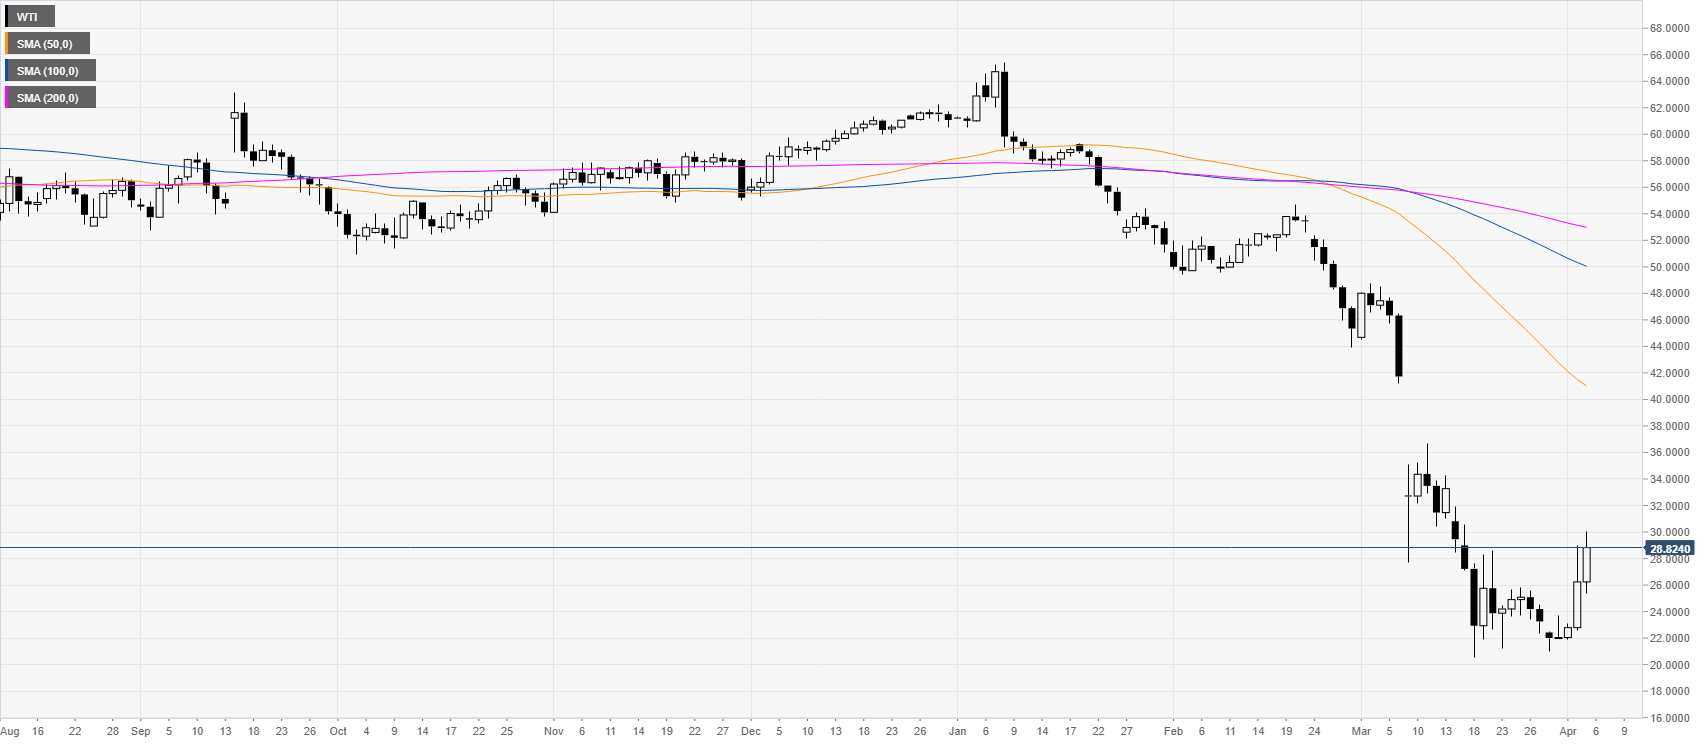
 

WTI daily chart

 
WTI is jumping from multi-year lows following the US President Trump’s tweet of yesterday (Thursday) suggesting a Saudi-Russian deal was on the pipeline.
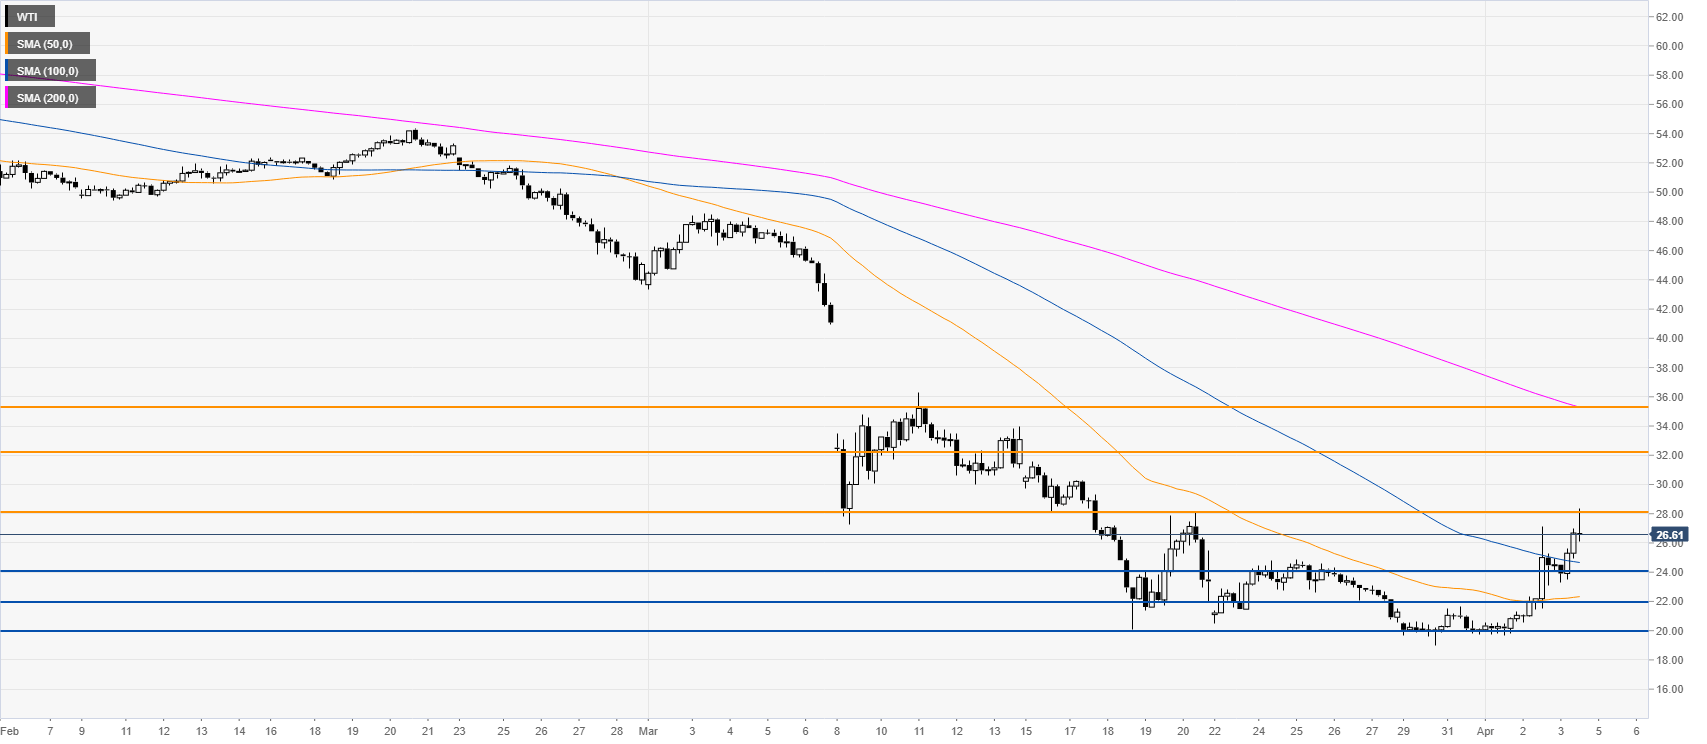
 

WTI four-hour chart

 
WTI is attempting to break from the range of the last weeks while holding above the 24.00 level and the 50/100 SMAs on the four-hour chart as a breakout above the 28.00 handle can introduce scope to further gains towards $32.00 a barrel. Support is seen near the 24.00, 22.00 and 20.00 levels. 
 

Additional key levels

WTI

Overview
Today last price28.75
Today Daily Change2.51
Today Daily Change %9.57
Today daily open26.24
 
Trends
Daily SMA2027.45
Daily SMA5041.43
Daily SMA10050.23
Daily SMA20053.13
 
Levels
Previous Daily High29.01
Previous Daily Low22.57
Previous Weekly High25.85
Previous Weekly Low21.19
Previous Monthly High48.74
Previous Monthly Low20.57
Daily Fibonacci 38.2%26.55
Daily Fibonacci 61.8%25.03
Daily Pivot Point S122.87
Daily Pivot Point S219.5
Daily Pivot Point S316.43
Daily Pivot Point R129.31
Daily Pivot Point R232.37
Daily Pivot Point R335.74

Author

Flavio Tosti

Flavio Tosti

Independent Analyst


More from Flavio Tosti
Share:

Editor's Picks

EUR/USD eyes nine-day EMA barrier after rebounding from 1.1600

EUR/USD gains ground after registering modest losses in the previous session, trading around 1.1620 during the Asian hours on Friday. The technical analysis of the daily chart suggests an ongoing bearish bias as the pair remains within the descending channel pattern.

GBP/USD drifts lower heading into NFP range

GBP/USD edged lower by 0.2% on Thursday, settling close to 1.3350 in a strained trading session that kept the pair pinned near three-month lows. Price briefly recovered earlier in the day on reports that Iran had indirectly signaled openness to talks with the CIA, but the bounce faded as Israeli officials reportedly advised Washington to disregard the overture. 

Gold awaits US Nonfarm Payrolls for a clear directional impetus

Gold rebounds above $5,100 early Friday after testing the $5,050 level amid global sell-off. The US Dollar pulls back as profit-taking creeps in ahead of US labor data. For February. 21-day SMA holds amid bullish RSI; a daily closing above 61.8% Fibo is critical for Gold buyers.

Ethereum pull in $169M as validators pile in to stake ETH

US spot Ethereum exchange-traded funds recorded $169 million in net inflows on Wednesday, marking the largest daily intake in two months, according to SoSoValue data. The rise in inflows signals renewed institutional interest in Ethereum amid broader market volatility.

The market compass is pointing at a barrel of Oil

The Asian open is arriving with equities leaning the wrong way, and the reason is not complicated. The market’s compass needle has snapped firmly toward crude. In this tape, oil is not just another input price; it is the gravitational center around which every asset class is orbiting.

Ripple tests recovery strength amid steady ETF inflows, growing retail interest

Ripple (XRP) continues to demonstrate notable resilience as the cryptocurrency market navigates the persistent war in the Middle East after the United States (US) and Israel attacked Iran on Saturday.