|

NZD/USD technical analysis: 4H 100MA, 61.8% Fibo. can trigger pullback

  • Near-term important support and oversold RSI question further declines.
  • 0.6610 becomes the key upside barrier.

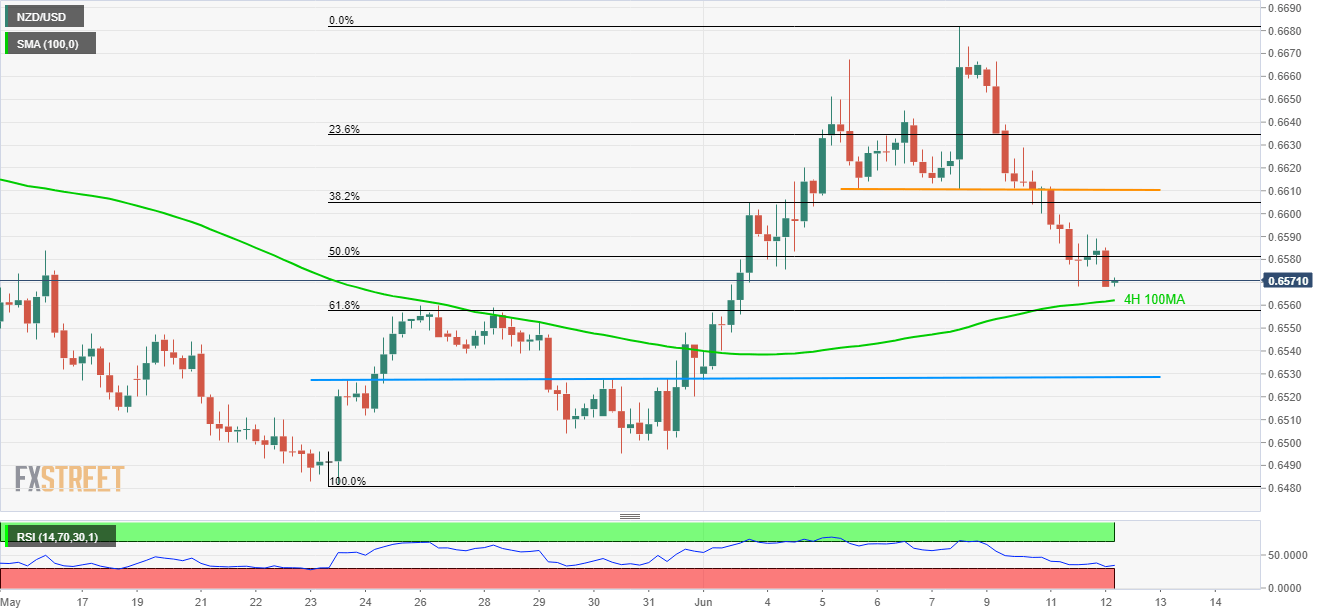
While sustained trading beneath 0.6610 portrays the NZD/USD pair’s weakness, 100-bar moving average and 61.8% Fibonacci retracement can limit further declines of the quote that seesaws around 0.6570 while heading into European open on Wednesday.

The 100-bar moving average on the 4-hour chart (4H 100MA) and 61.8% Fibonacci retracement of latest upside together constitute 0.6562 – 0.6557 support area. Adding to the support strength could be oversold levels of 14-bar relative strength index (RSI).

Should sellers refrain from respecting 0.6557 rest-point, its drop to 0.6530 horizontal mark 0.6500 and then to 0.6480 can’t be denied.

Alternatively, 0.6590 could become immediate resistance to watch during the pullback prior to highlighting 0.6610 horizontal-line for one more time.

If there prevails an extended north-run past-0.6610, 0.6655 and 0.6685 could become buyers’ favorites.

NZD/USD 4-Hour chart

Trend: Pullback expected

Additional important levels

Overview
Today last price0.6571
Today Daily Change-7 pips
Today Daily Change %-0.11%
Today daily open0.6578
 
Trends
Daily SMA200.6559
Daily SMA500.6627
Daily SMA1000.673
Daily SMA2000.671
Levels
Previous Daily High0.6612
Previous Daily Low0.6568
Previous Weekly High0.6682
Previous Weekly Low0.6528
Previous Monthly High0.6684
Previous Monthly Low0.6481
Daily Fibonacci 38.2%0.6585
Daily Fibonacci 61.8%0.6595
Daily Pivot Point S10.656
Daily Pivot Point S20.6542
Daily Pivot Point S30.6516
Daily Pivot Point R10.6604
Daily Pivot Point R20.663
Daily Pivot Point R30.6648

Author

Anil Panchal

Anil Panchal

FXStreet

Anil Panchal has nearly 15 years of experience in tracking financial markets. With a keen interest in macroeconomics, Anil aptly tracks global news/updates and stays well-informed about the global financial moves and their implications.

More from Anil Panchal
Share:

Editor's Picks

EUR/USD recedes to daily lows near 1.1850

EUR/USD keeps its bearish momentum well in place, slipping back to the area of 1.1850 to hit daily lows on Monday. The pair’s continuation of the leg lower comes amid decent gains in the US Dollar in a context of scarce volatility and thin trade conditions due to the inactivity in the US markets.

GBP/USD resumes the downtrend, back to the low-1.3600s

GBP/USD rapidly leaves behind Friday’s decent advance, refocusing on the downside and retreating to the 1.3630 region at the beginning of the week. In the meantime, the British Pound is expected to remain under the microscope ahead of the release of the key UK labour market report on Tuesday.

Gold looks inconclusive around $5,000

Gold partially fades Friday’s strong recovery, orbiting around the key $5,000 region per troy ounce in a context of humble gains in the Greenback on Monday. Additing to the vacillating mood, trade conditions remain thin amid the observance of the Presidents Day holiday in the US.

Bitcoin consolidates as on-chain data show mixed signals

Bitcoin price has consolidated between $65,700 and $72,000 over the past nine days, with no clear directional bias. US-listed spot ETFs recorded a $359.91 million weekly outflow, marking the fourth consecutive week of withdrawals.

The week ahead: Key inflation readings and why the AI trade could be overdone

It is likely to be a quiet start to the week, with US markets closed on Monday for Presidents Day. European markets are higher across the board and gold is clinging to the $5,000 level after the tamer than expected CPI report in the US reduced haven flows to precious metals.

XRP steadies in narrow range as fund inflows, futures interest rise

Ripple is trading in a narrow range between $1.45 (immediate support) and $1.50 (resistance) at the time of writing on Monday. The remittance token extended its recovery last week, peaking at $1.67 on Sunday from the weekly open at $1.43.