NZD/USD Price Forecast: Rallies above 0.5800, eyes on 200-day SMA
- NZD/USD jumps on ceasefire optimism and hawkish RBNZ commentary.
- RSI breaks above 50, signaling strengthening bullish momentum.
- Failure above the 200-day SMA risks a pullback toward 0.5800 support.
The NZD/USD pair rallies sharply on Wednesday, boosted by a double whammy: The de-escalation of the Middle East conflict and hawkish remarks by the Reserve Bank of New Zealand (RBNZ) Governor, Anna Breman, following the bank’s monetary policy meeting. At the time of writing, the pair trades at 0.5816 after rebounding at daily lows of 0.5715.
NZD/USD Price Forecast: Technical Outlook
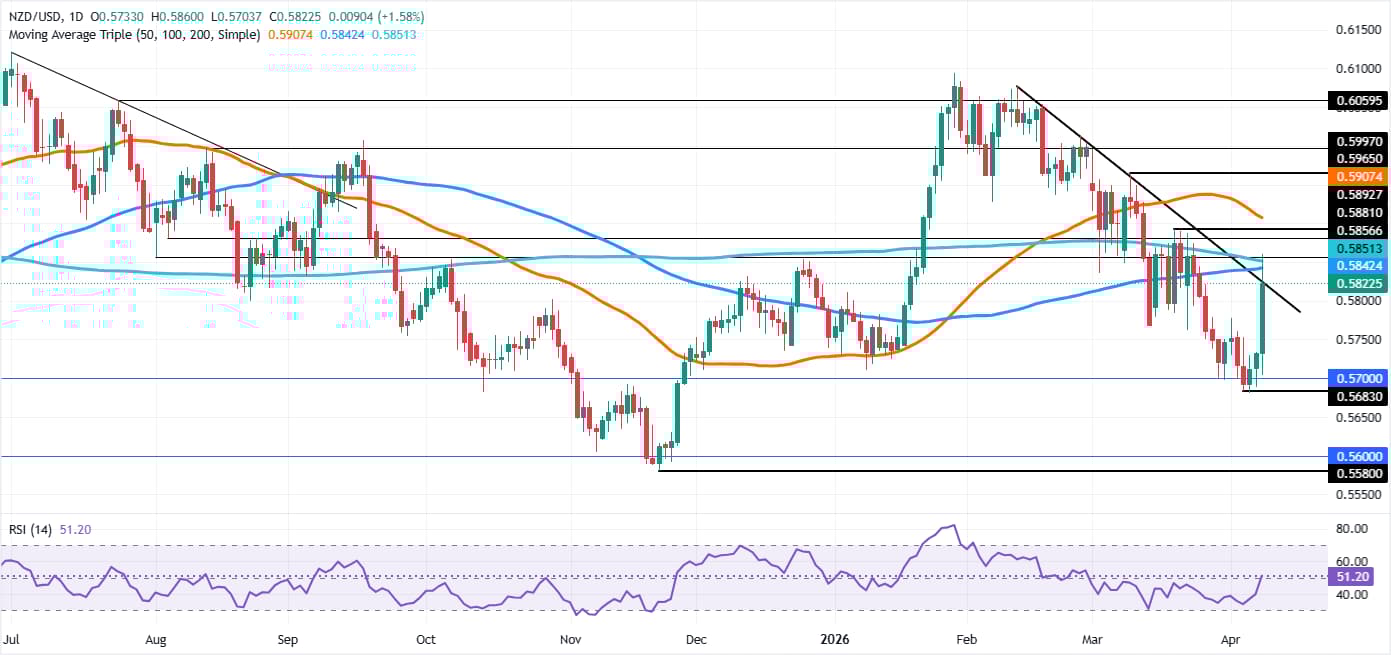
From a technical perspective, NZD/USD is set to consolidate after reaching a two-week high of 0.5860, but it has failed to sustain its gains above the 200-day Simple Moving Average (SMA) at 0.5849, which could exacerbate a fall below 0.5800.
Nevertheless, momentum shifted bullish, with the Relative Strength Index (RSI) spiking above its 50-neutral level, an indication that buyers are gaining strength.
Should the pair regain the 100-day SMA at 0.5840, it will expose the 200-day SMA immediately at 0.5859. Once those levels are taken out, a rally towards 0.5900 is on the cards. A break above puts into play the 50-day SMA at 0.5904, followed by the March 10 high at 0.5964.
On the flipside, if NZD/USD drops below 0.5800, it will find fresh buying interest at the 20-day SMA at 0.5784. The break of support opens the way for a test of the April 8 daily low at 0.5715, ahead of 0.5700.
NZD/USD Price — Chart
New Zealand Dollar FAQs
The New Zealand Dollar (NZD), also known as the Kiwi, is a well-known traded currency among investors. Its value is broadly determined by the health of the New Zealand economy and the country’s central bank policy. Still, there are some unique particularities that also can make NZD move. The performance of the Chinese economy tends to move the Kiwi because China is New Zealand’s biggest trading partner. Bad news for the Chinese economy likely means less New Zealand exports to the country, hitting the economy and thus its currency. Another factor moving NZD is dairy prices as the dairy industry is New Zealand’s main export. High dairy prices boost export income, contributing positively to the economy and thus to the NZD.
The Reserve Bank of New Zealand (RBNZ) aims to achieve and maintain an inflation rate between 1% and 3% over the medium term, with a focus to keep it near the 2% mid-point. To this end, the bank sets an appropriate level of interest rates. When inflation is too high, the RBNZ will increase interest rates to cool the economy, but the move will also make bond yields higher, increasing investors’ appeal to invest in the country and thus boosting NZD. On the contrary, lower interest rates tend to weaken NZD. The so-called rate differential, or how rates in New Zealand are or are expected to be compared to the ones set by the US Federal Reserve, can also play a key role in moving the NZD/USD pair.
Macroeconomic data releases in New Zealand are key to assess the state of the economy and can impact the New Zealand Dollar’s (NZD) valuation. A strong economy, based on high economic growth, low unemployment and high confidence is good for NZD. High economic growth attracts foreign investment and may encourage the Reserve Bank of New Zealand to increase interest rates, if this economic strength comes together with elevated inflation. Conversely, if economic data is weak, NZD is likely to depreciate.
The New Zealand Dollar (NZD) tends to strengthen during risk-on periods, or when investors perceive that broader market risks are low and are optimistic about growth. This tends to lead to a more favorable outlook for commodities and so-called ‘commodity currencies’ such as the Kiwi. Conversely, NZD tends to weaken at times of market turbulence or economic uncertainty as investors tend to sell higher-risk assets and flee to the more-stable safe havens.
Author

Christian Borjon Valencia
FXStreet
Markets analyst, news editor, and trading instructor with over 14 years of experience across FX, commodities, US equity indices, and global macro markets.


