NZD/USD Price Forecast: Hovers around 0.5750 near nine-day EMA support
- NZD/USD could target the two-month high at 0.5794.
- The 14-day RSI stays above the 50 level, reinforcing the bullish sentiment.
- The nine-day EMA at 0.5721 level appears as the immediate support.

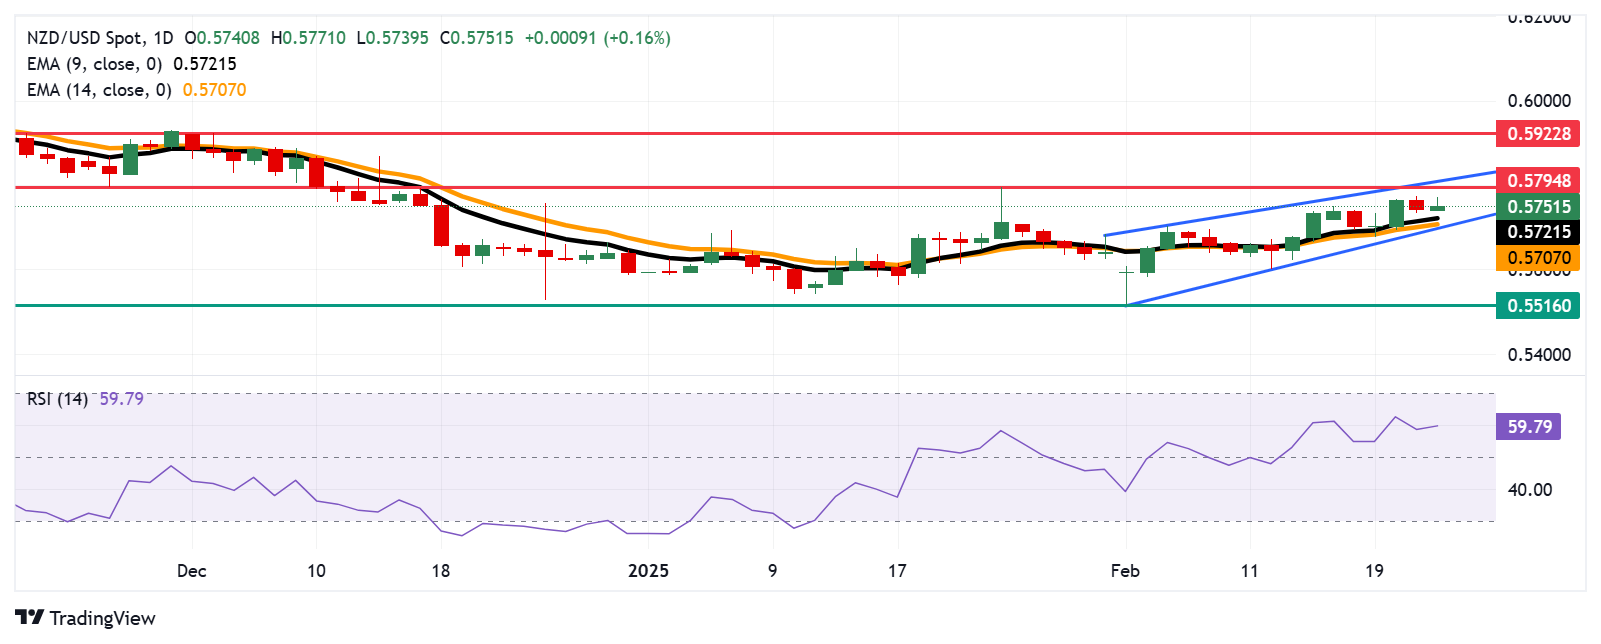
The NZD/USD pair maintains its gains around 0.5750 during European trading hours on Monday. Technical analysis of the daily chart suggests a bullish market outlook, as the pair continues to trade within an ascending channel pattern.
The 14-day Relative Strength Index (RSI) remains above the 50 level, strengthening the bullish outlook. Moreover, the NZD/USD pair stays positioned above the nine- and 14-day Exponential Moving Averages (EMAs), indicating robust short-term momentum.
On the upside, the NZD/USD pair could target the two-month high at 0.5794, reached on January 24, followed by the upper boundary of the ascending channel at the 0.5810 level. A break above this critical resistance zone could reinforce the bullish bias and lead the pair to approach the three-month high at 0.5922, last seen on December 3.
The NZD/USD pair could find immediate support at the nine-day EMA at 0.5721, followed by a 14-day EMA at 0.5707 level. Further support region appears at the ascending channel’s lower boundary at 0.5700 level.
A break below the channel would weaken the bullish bias and put downward pressure on the NZD/USD pair to navigate the region around 0.5516, its lowest point since October 2022, recorded on February 3.
NZD/USD: Daily Chart
New Zealand Dollar PRICE Today
The table below shows the percentage change of New Zealand Dollar (NZD) against listed major currencies today. New Zealand Dollar was the strongest against the Japanese Yen.
| USD | EUR | GBP | JPY | CAD | AUD | NZD | CHF | |
|---|---|---|---|---|---|---|---|---|
| USD | -0.17% | -0.16% | 0.19% | -0.15% | -0.22% | -0.16% | -0.03% | |
| EUR | 0.17% | -0.08% | 0.17% | -0.17% | -0.07% | -0.18% | -0.04% | |
| GBP | 0.16% | 0.08% | 0.32% | -0.09% | 0.01% | -0.10% | 0.05% | |
| JPY | -0.19% | -0.17% | -0.32% | -0.34% | -0.33% | -0.28% | -0.13% | |
| CAD | 0.15% | 0.17% | 0.09% | 0.34% | -0.12% | -0.01% | 0.14% | |
| AUD | 0.22% | 0.07% | -0.01% | 0.33% | 0.12% | -0.11% | 0.04% | |
| NZD | 0.16% | 0.18% | 0.10% | 0.28% | 0.01% | 0.11% | 0.15% | |
| CHF | 0.03% | 0.04% | -0.05% | 0.13% | -0.14% | -0.04% | -0.15% |
The heat map shows percentage changes of major currencies against each other. The base currency is picked from the left column, while the quote currency is picked from the top row. For example, if you pick the New Zealand Dollar from the left column and move along the horizontal line to the US Dollar, the percentage change displayed in the box will represent NZD (base)/USD (quote).
Author

Akhtar Faruqui
FXStreet
Akhtar Faruqui is a Forex Analyst based in New Delhi, India. With a keen eye for market trends and a passion for dissecting complex financial dynamics, he is dedicated to delivering accurate and insightful Forex news and analysis.


