NZD/USD Price Forecast: Bears await break below 61.8% Fibo., around 0.5970 area
- NZD/USD drifts lower for the second consecutive day amid the risk-off impulse.
- Reduced Fed rate cut bets and trade jitters benefit the USD and weigh on the Kiwi.
- The technical setup favors bearish traders and backs the case for further losses.

The NZD/USD pair attracts sellers for the second consecutive day on Monday and slides further below the 0.6000 psychological mark during the Asian session. Spot prices currently trade near the 0.5980-0.5975 support, or the monthly low touched last week, and seem vulnerable amid rising trade tensions.
US President Donald Trump upped the ante on trade wars on Saturday by announcing 30% tariffs on products coming from the European Union (EU) and Mexico starting August 1. This, in turn, tempers investors' appetite for riskier assets, which, along with reduced bets for an immediate interest rate cut by the Federal Reserve (Fed), acts as a tailwind for the safe-haven US Dollar (USD) and undermines the risk-sensitive Kiwi.
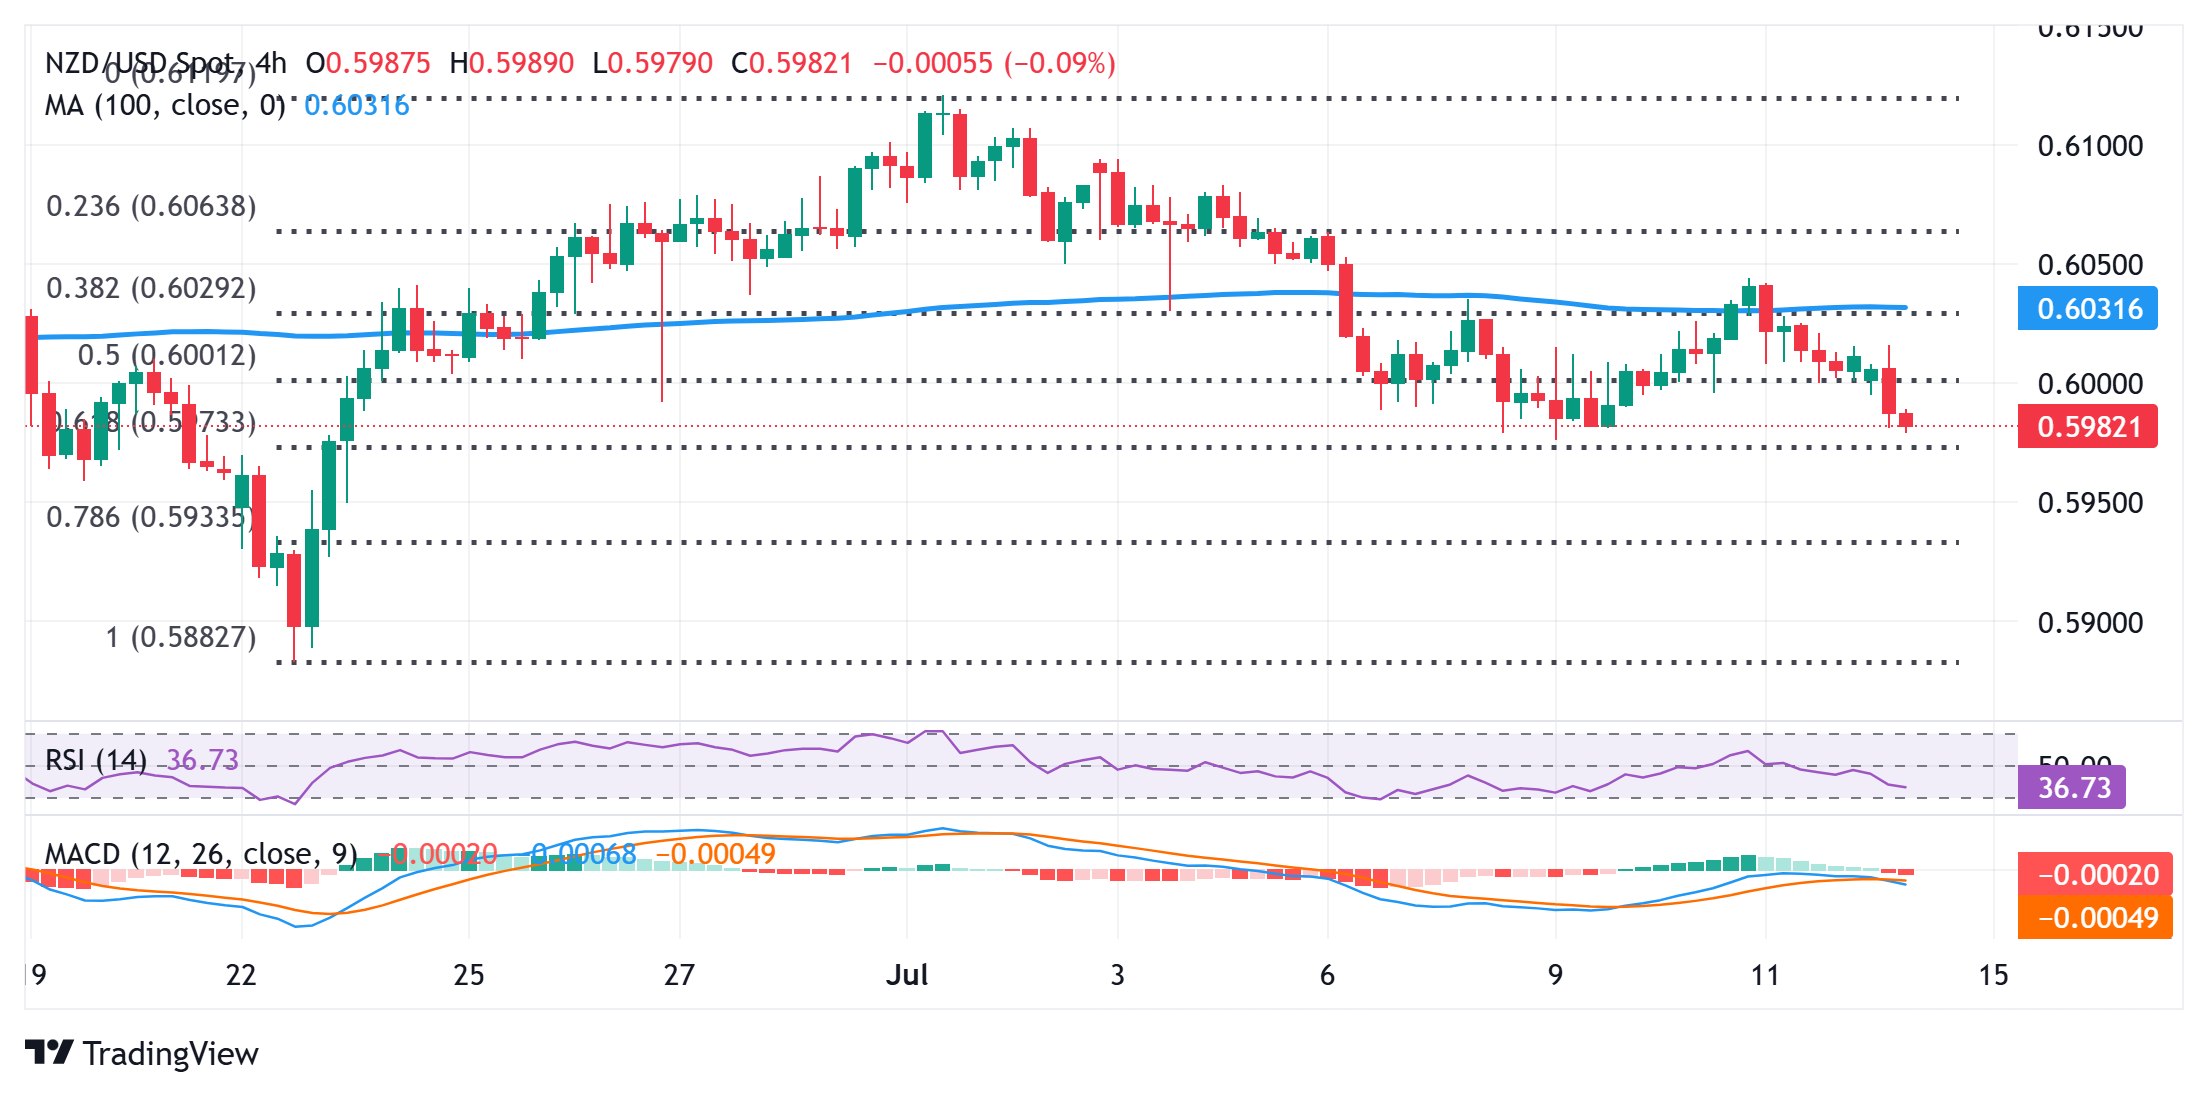
From a technical perspective, last week's failure near the 100-period Simple Moving Average (SMA) support breakpoint on the 4-hour chart favors the NZD/USD bears. Moreover, negative oscillators on hourly/daily charts suggest that the path of least resistance for spot prices is to the downside and back the case for an extension of the corrective slide from the 0.6120 area, or the highest level since October 2024 touched earlier this month.
However, it will still be prudent to wait for some follow-through selling below the 61.8% Fibonacci retracement level of the June-July rally, around the 0.5970 area, before positioning for deeper losses. The NZD/USD pair might then turn vulnerable to accelerate the downfall towards the next relevant support near the 0.5935 area before eventually dropping to the 0.5900 round figure and June monthly swing low, around the 0.5880 region.
On the flip side, attempted recovery might now confront some resistance near the 0.6025 area (50% retracement level), above which the NZD/USD pair could climb to the 0.6060 region, or the 38.2% Fibo. retracement level. The subsequent move up could allow spot prices to reclaim the 0.6100 mark and retest the year-to-date peak, around the 0.6120 zone. A sustained move beyond the latter might shift the near-term bias in favor of bullish traders.
NZD/USD 4-hour chart
US Dollar PRICE Last 7 days
The table below shows the percentage change of US Dollar (USD) against listed major currencies last 7 days. US Dollar was the strongest against the Japanese Yen.
| USD | EUR | GBP | JPY | CAD | AUD | NZD | CHF | |
|---|---|---|---|---|---|---|---|---|
| USD | 0.92% | 1.33% | 2.25% | 0.75% | -0.04% | 1.31% | 0.49% | |
| EUR | -0.92% | 0.42% | 1.08% | -0.20% | -0.89% | 0.38% | -0.45% | |
| GBP | -1.33% | -0.42% | 0.62% | -0.59% | -1.30% | -0.03% | -0.98% | |
| JPY | -2.25% | -1.08% | -0.62% | -1.23% | -2.01% | -0.68% | -1.65% | |
| CAD | -0.75% | 0.20% | 0.59% | 1.23% | -0.76% | 0.57% | -0.39% | |
| AUD | 0.04% | 0.89% | 1.30% | 2.01% | 0.76% | 1.39% | 0.31% | |
| NZD | -1.31% | -0.38% | 0.03% | 0.68% | -0.57% | -1.39% | -0.95% | |
| CHF | -0.49% | 0.45% | 0.98% | 1.65% | 0.39% | -0.31% | 0.95% |
The heat map shows percentage changes of major currencies against each other. The base currency is picked from the left column, while the quote currency is picked from the top row. For example, if you pick the US Dollar from the left column and move along the horizontal line to the Japanese Yen, the percentage change displayed in the box will represent USD (base)/JPY (quote).
Author

Haresh Menghani
FXStreet
Haresh Menghani is a detail-oriented professional with 10+ years of extensive experience in analysing the global financial markets.


