NZD/USD Price Analysis: Portrays another attempt to cross weekly hurdle near 0.6300
- NZD/USD remains mildly bid as bulls approach short-term resistance line amid sluggish session.
- Sustained trading beyond 50-HMA, firmer RSI adds strength to bullish bias.
- One-week-old horizontal support area adds to the downside filters.

NZD/USD picks up bids to 0.6290 as buyers struggle to keep reins during the dicey session heading into the European open on Wednesday.
In doing so, the Kiwi pair justifies the sustained trading beyond the 50-HMA, as well as the recently firmer RSI (14), amid an inactive trading day ahead of the US inflation data.
However, a downward sloping resistance line from the last Thursday, near the 0.6300 threshold by the press time, appears to challenge immediate NZD/USD upside moves.
Following that, a run-up towards the monthly peak of 0.6352 can’t be ruled out. However, the quote’s upside past-0.6352 appears difficult amid the likely overbought RSI on the short time frame at that place.
Should the NZD/USD remains firmer above 0.6352, the mid-June swing high near 0.6400 could return to the charts.
On the contrary, the 50-HMA level of 0.6280 restricts the immediate downside of the NZD/USD pair.
Following that, the 61.8% Fibonacci retracement of July 27 to August 01 up-moves, near 0.6250, will precede the one-week-old horizontal support zone around 0.6210 to challenge further declines of the Kiwi pair.
If at all the NZD/USD remains bearish past 0.6210, the 0.6200 may act as the last defense of the bulls before directing prices towards the yearly low marked in July near 0.6060.
NZD/USD: Hourly chart
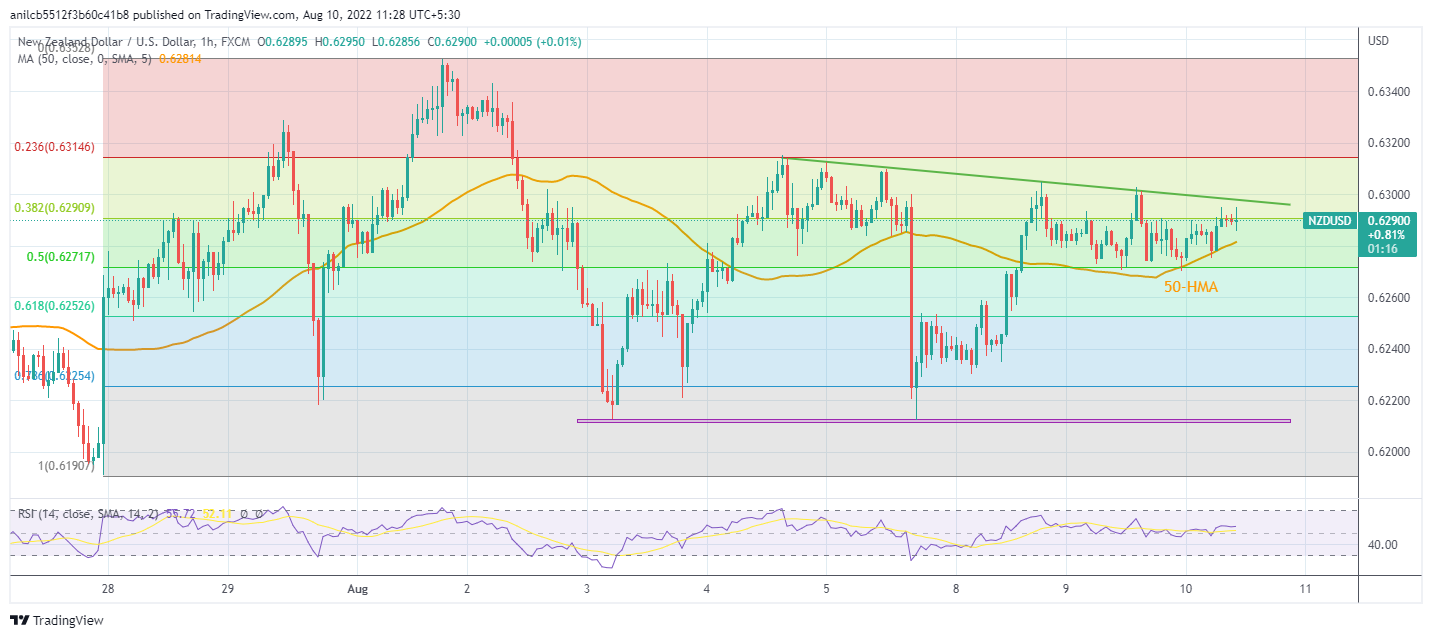
Trend: Pullback expected
Author

Anil Panchal
FXStreet
Anil Panchal has nearly 15 years of experience in tracking financial markets. With a keen interest in macroeconomics, Anil aptly tracks global news/updates and stays well-informed about the global financial moves and their implications.


