|

NZD/USD Price Analysis: Pair conquers 20-day SMA, but 100-day SMA crossover raises concerns

  • Friday's session saw NZD/USD rally 0.61% to trade around 0.5930.
  • Price action shows recent gains and a recovery to the 20-day SMA, indicating potential for a reversal.
  • Indicators look promising and approaching positive areas so the pair may see further upside.

The NZD/USD pair surged by 0.61% on Friday's session, continuing the recovery from last week's lows and reaching 0.5930.

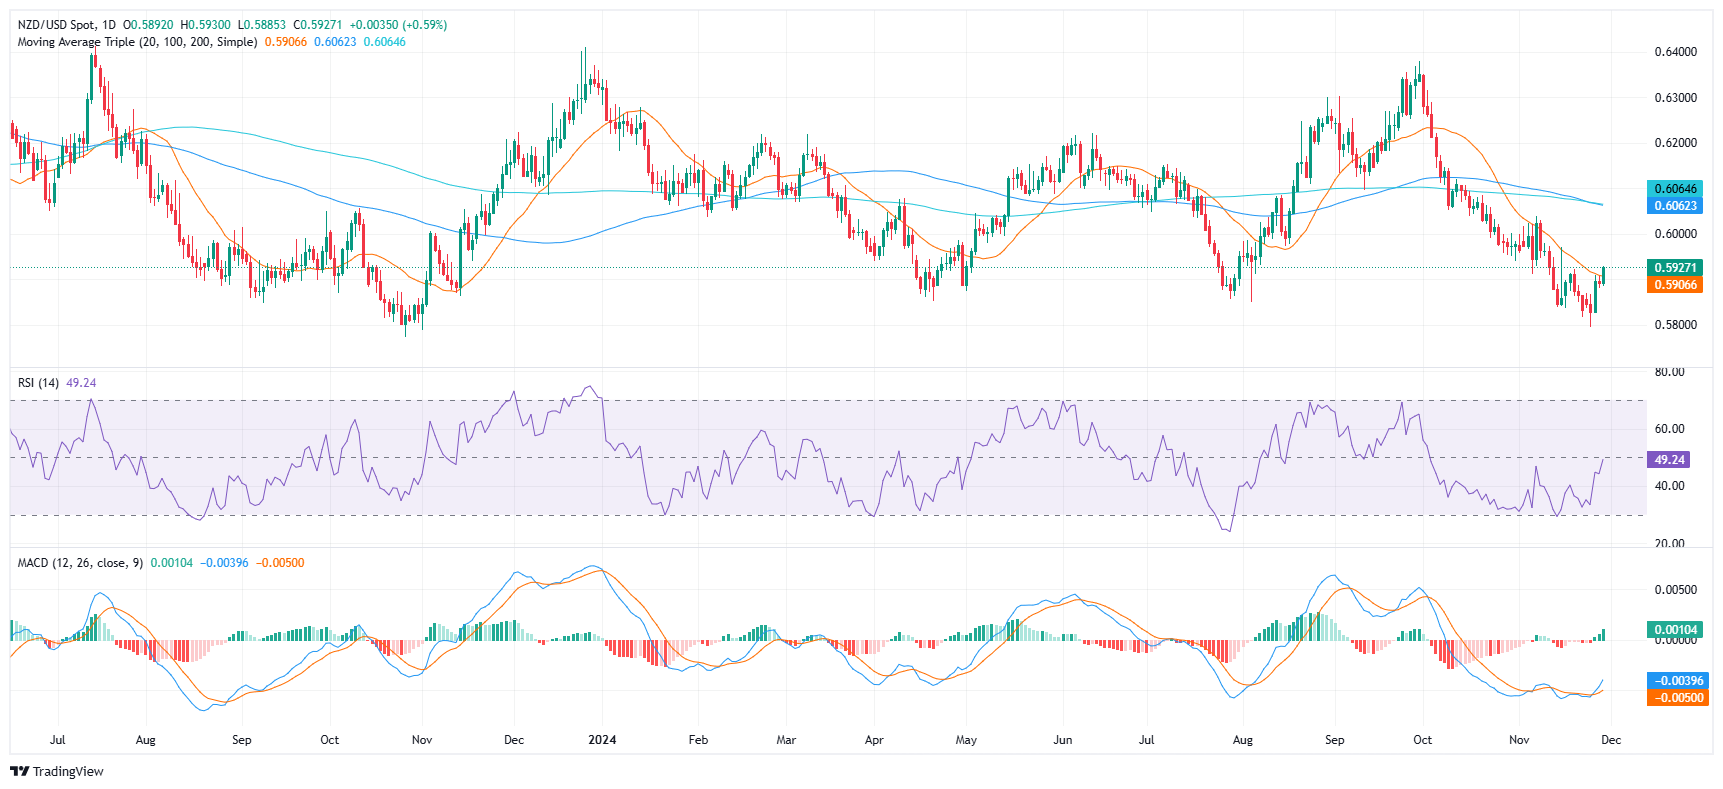
The pair has resumed its upward trajectory, fueled by positive technical indicators. The Relative Strength Index (RSI) has moved near positive territory at around 49, signaling increasing buying pressure and bullish sentiment. Moreover, the Moving Average Convergence Divergence (MACD) indicator displays a rising green histogram, further confirming the bullish momentum.

The Kiwi's pair's recent rally has seen it conquer the 20-day Simple Moving Average (SMA) of 0.5905, signaling potential for a bullish reversal. However, the lingering bearish crossover between the 100-day and 200-day SMAs at 0.6060 raises concerns about the sustainability of the gains. Positive technical indicators, including the RSI and MACD, suggest buying pressure is rising and support bullish momentum..

NZD/USD daily chart

Author

Patricio Martín

Patricio is an economist from Argentina passionate about global finance and understanding the daily movements of the markets.

More from Patricio Martín
Share:

Editor's Picks

GBP/USD extends slide to fresh 2026-low near 1.3150

GBP/USD resumes its downside in the second half of the day on Wednesday and trades at its lowest level since November 2025 near 1.3150. The pair remains vulnerable amid a broadly firmer US Dollar and chaotic UK political environment. The focus is now on BoE-speak for further trading impetus.

EUR/USD slumps to new yearly low below 1.1350

EUR/USD stays under bearish pressure and trades at its lowest level in a year below 1.1350 on Wednesday. The pair remains vulnerable to further declines amid a bullish US Dollar, which continues to draw support from hawkish Fed bets and US-Iran peace deal uncertainty.

Gold closes in on $4,000 on persistent USD strength

Gold remains under persistent selling pressure and trades at its lowest level since November near $4,000 on Wednesday, losing more than 2.5% on the day. Hawkish Fed pricing, broad-based US Dollar strength and the uncertainty surrounding the US-Iran peace agreement make it difficult for the precious metal to find a foothold.

Crypto Today: Bitcoin, Ethereum, XRP trade under pressure as September Fed rate-hike odds increase

Bitcoin is trading between $62,000 and $63,000 at the time of writing on Wednesday, weighed down by headwinds stemming from macroeconomic uncertainty and geopolitical tensions in the Middle East.

5.90% to 5.45%: Why the Pound ignored the bond market’s relief rally

Keir Starmer resigned on Monday, and the Pound barely moved. That near-silence is the tell. Sterling's real driver these past four months has not been the prime minister, nor the left-leaning frontrunner lining up to replace him, but the long end of the gilt curve, which answers to a force no British politician controls.

Regime change: Inside Kevin Warsh's first move to make the Fed unreadable on purpose

The rate did not move. That was the least interesting thing about Kevin Warsh's first meeting in charge of the Fed. The FOMC held its benchmark at 3.50%-3.75% for the fourth straight meeting, exactly as priced, and then the new chair used his first press conference to dismantle the machinery the market has leaned on for a decade.