|

NZD/USD Price Analysis: Kiwi retreats from key resistance around 0.6150

  • NZD/USD snaps two-day uptrend despite bouncing off intraday low of late.
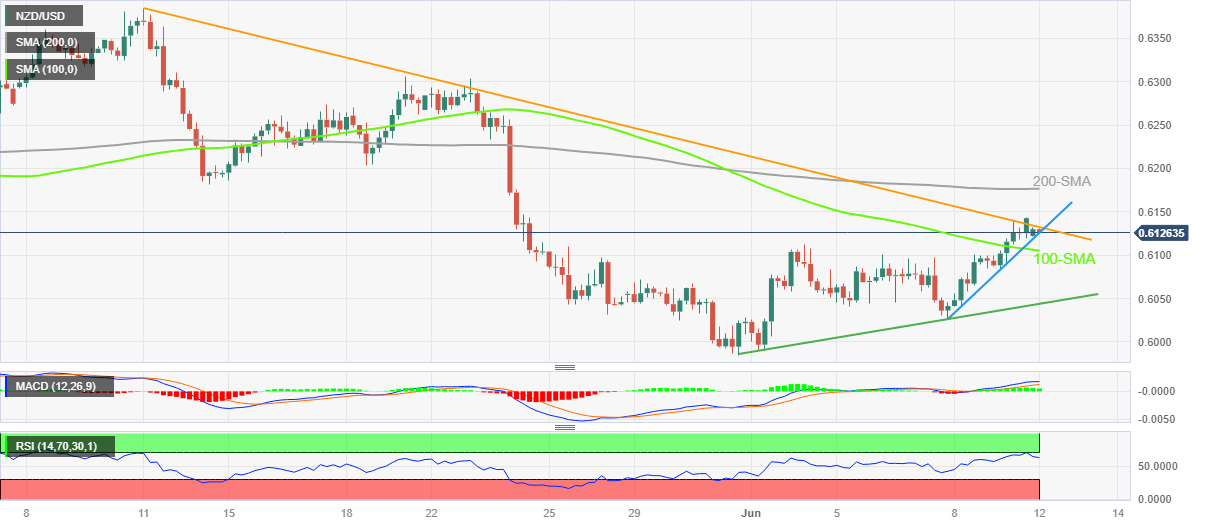
  • One-month-old descending resistance line, 200-SMA prod Kiwi pair buyers.
  • RSI conditions challenge bulls but immediate support line, 100-SMA restrict intraday fall.

NZD/USD picks up bids to consolidate intraday losses, the first in three days, as it rises to 0.6135 during early Monday. That said, the Kiwi pair reversed from a one-month-old descending resistance line to begin the key week comprising New Zealand growth numbers, the Federal Open Market Committee (FOMC) monetary policy decision and the US inflation.

Apart from a downward-sloping resistance line from May 11, close to 0.6135 by the press time, the overbought RSI (14) line also challenges the NZD/USD buyers.

It should be noted that the Kiwi pair’s upside past 0.6135 needs validation from the 200-SMA hurdle of around 0.6175 to convince the bulls. Following that, highs marked during late May, around 0.6305, will be in the spotlight.

On the flip side, an upward-sloping support line from the last Wednesday, near 0.6120 by the press time, limits the adjacent fall of the NZD/USD pair. Also acting as a downside filter is the 100-bar SMA, close to 0.6100 at the latest.

In a case where the Kiwi pair drops below 0.6100, an ascending trend line from May 31, near 0.6040 as we write, will act as the last defense of the bears.

Overall, NZD/USD teases buyers as the key week begins, despite witnessing multiple hurdles toward the north.

NZD/USD: Four-hour chart

Trend: Pullback expected

Additional important levels

Overview
Today last price0.6129
Today Daily Change-0.0014
Today Daily Change %-0.23%
Today daily open0.6143
 
Trends
Daily SMA200.6125
Daily SMA500.6188
Daily SMA1000.6234
Daily SMA2000.6149
 
Levels
Previous Daily High0.6143
Previous Daily Low0.6084
Previous Weekly High0.6143
Previous Weekly Low0.6026
Previous Monthly High0.6385
Previous Monthly Low0.5985
Daily Fibonacci 38.2%0.6121
Daily Fibonacci 61.8%0.6107
Daily Pivot Point S10.6103
Daily Pivot Point S20.6064
Daily Pivot Point S30.6044
Daily Pivot Point R10.6163
Daily Pivot Point R20.6183
Daily Pivot Point R30.6222

Author

Anil Panchal

Anil Panchal

FXStreet

Anil Panchal has nearly 15 years of experience in tracking financial markets. With a keen interest in macroeconomics, Anil aptly tracks global news/updates and stays well-informed about the global financial moves and their implications.

More from Anil Panchal
Share:

Editor's Picks

AUD/USD consolidates above 0.7000/two-month low; bearish potential intact

The AUD/USD pair oscillates in a narrow range during the Asian session, and moves little following the release of mixed inflation figures from China. Spot prices currently trade around the 0.7025 region, nearly unchanged for the day, and remain within striking distance of a nearly two-month low set on Tuesday. Renewed hostilities between the US and Iran temper hopes for a deal to end the over three-month-old war.

Japanese Yen languishes despite wholesale inflation accelerates in May

USD/JPY flatlines after experiencing volatility, trading around 160.40 during the Asian hours on Wednesday. The pair continues to hold its ground, reflecting a struggling Japanese Yen that has failed to find support despite a massive acceleration in wholesale inflation. Driven by surging energy costs linked to the ongoing Middle East conflict, Japan’s Producer Price Index jumped 6.3% year-over-year in May. This hot printing comfortably outpaced April’s upwardly revised 5.3% figure and surpassed market consensus of 5.5%, marking the fastest pace of wholesale price growth in three years.

$4,200: Gold retains bearish bias near March low ahead of US CPI

Gold recovers slightly after touching a fresh low since March 23, though it retains a bearish bias near the $4,200 mark through the early European session. Renewed hostilities between the US and Iran fuel inflationary concerns and bolster bets for more hawkish central banks, which is seen as a key factor driving flows away from the non-yielding yellow metal. Furthermore, the decline could be attributed to technical selling following the recent breakdown below the very important 200-day SMA.

Cardano's downtrend deepens despite on-chain bottoming signals

Cardano edges lower to $0.1600 signaling a potential extension of the 30% loss from last week. The altcoin remains under intense selling pressure, weighing on its retail support. Still, a spike in dormant supply re-entering circulation signals that the selling pressure has run its course, a pattern that often precedes a rebound.

US CPI data set to show inflation at three-year high in May, backing Fed hawkish tilt

The US Bureau of Labor Statistics will publish the May Consumer Price Index (CPI) data on Wednesday. The report is expected to show another step up in consumer inflation, driven by the persistently high Oil prices due to the ongoing crisis in the Middle East.

The US economy defies the rules: 100 days into the Oil shock and the recession signal is still missing

More than three months after the start of the Iran war and the resulting disruption to global energy markets, the US economy continues to display remarkable resilience. The conflict has triggered a sharp rise in Oil prices, reignited inflationary pressures and fueled widespread concerns about a potential economic slowdown.