|

NZD/USD Price Analysis: Further upside remains elusive below 0.6365 support-turned-resistance

  • NZD/USD struggles to defend two-day uptrend, seesaws around intraday high.
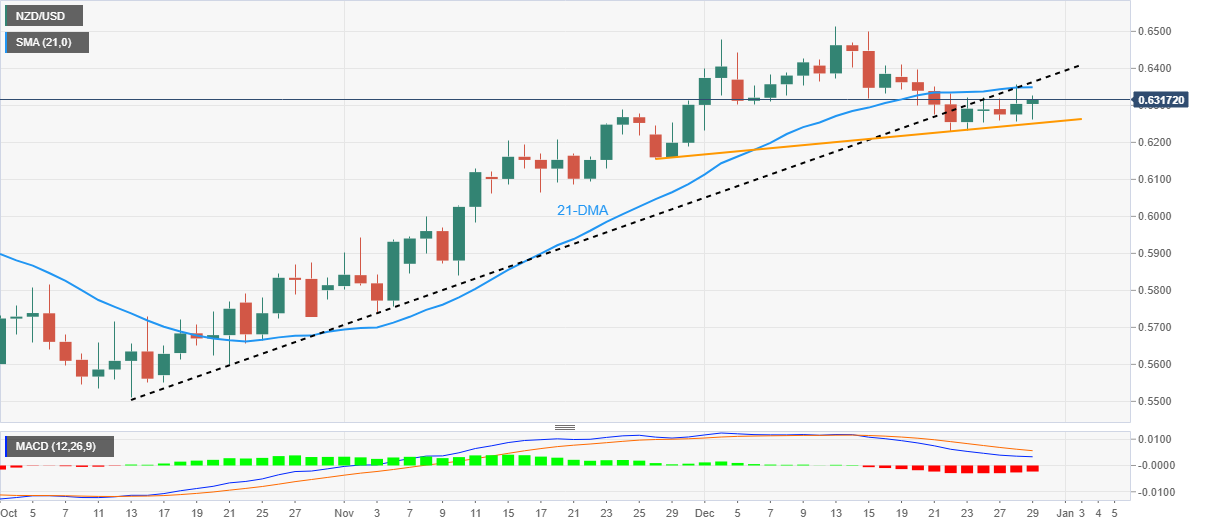
  • Bearish MACD signals, sustained trading below 21-DMA keep sellers hopeful.
  • One-month-old ascending trend line restricts immediate downside before the monthly low.

NZD/USD makes rounds to 0.6320 while printing mild gains for the second consecutive day during early Thursday.

In doing so, the Kiwi pair defends the previous weekly rebound from a one-month-old ascending support line, as well as portrays a struggle to cross the 21-DMA hurdle amid bearish MACD signals.

In addition to the 21-DMA level surrounding 0.6350, the previous support line stretched from October 13, now resistance around 0.6365, also challenges the NZD/USD buyers.

Even if the quote crosses the 0.6365 hurdle, the 0.6400 round figure and the monthly peak of 0.6514 could restrict the pair’s further upside. It should be noted that the NZD/USD pair’s successful trading beyond 0.6515 will need validation from June’s peak of 0.6575.

Hence, multiple hurdles stand ready to challenge the Kiwi pair’s latest recovery.

On the flip side, an upward-sloping support line from late November, close to 0.6250 by the press time, restricts the immediate downside of the NZD/USD price.

Following that, the bears may aim for the monthly lows and troughs marked during late November, respectively around 0.6230 and 0.6155.

It’s worth mentioning that the multiple lows marked during mid-November, around 0.6065-60 could challenge the NZD/USD bears past 0.6155, a break of which won’t hesitate to challenge the 0.6000 psychological magnet.

NZD/USD: Daily chart

Trend: Limited upside expected

Additional important levels

Overview
Today last price0.6319
Today Daily Change0.0015
Today Daily Change %0.24%
Today daily open0.6304
 
Trends
Daily SMA200.6351
Daily SMA500.6135
Daily SMA1000.6042
Daily SMA2000.6247
 
Levels
Previous Daily High0.6356
Previous Daily Low0.6257
Previous Weekly High0.641
Previous Weekly Low0.623
Previous Monthly High0.6314
Previous Monthly Low0.5741
Daily Fibonacci 38.2%0.6318
Daily Fibonacci 61.8%0.6295
Daily Pivot Point S10.6255
Daily Pivot Point S20.6207
Daily Pivot Point S30.6156
Daily Pivot Point R10.6354
Daily Pivot Point R20.6405
Daily Pivot Point R30.6453

Author

Anil Panchal

Anil Panchal

FXStreet

Anil Panchal has nearly 15 years of experience in tracking financial markets. With a keen interest in macroeconomics, Anil aptly tracks global news/updates and stays well-informed about the global financial moves and their implications.

More from Anil Panchal
Share:

Markets move fast. We move first.

Orange Juice Newsletter brings you expert driven insights - not headlines. Every day on your inbox.

By subscribing you agree to our Terms and conditions.

Editor's Picks

EUR/USD edges above 1.1750 due to ECB-Fed policy divergence

EUR/USD has recovered its recent losses registered in the previous session, trading around 1.1760 during the Asian hours on Friday. Traders will likely observe Germany’s Manufacturing Purchasing Managers’ Index data later in the day.

GBP/USD gathers strength above 1.3450 on Fed rate cut bets, BoE's gradual policy path

The GBP/USD pair gathers strength to around 1.3480 during the early Asian session on Friday. Expectations of the US Federal Reserve rate cuts this year weigh on the US Dollar against the Pound Sterling. Philadelphia Fed President Anna Paulson is set to speak later on the weekend. 

Gold climbs to near $4,350 on Fed rate cut bets, geopolitical risks

Gold price rises to near $4,345 during the early Asian session on Friday. Gold finished 2025 with a significant rally, achieving an annual gain of around 65%, its biggest annual gain since 1979. The rally of the precious metal is bolstered by the prospect of further US interest rate cuts in 2026 and safe-haven flows.

Bitcoin, Ethereum and Ripple enter the New Year with breakout hopes

Bitcoin, Ethereum, and Ripple entered the new year trading at key technical levels on Friday, as traders seek fresh directional cues in January. With BTC locked in a tight range, ETH is approaching its 50-day Exponential Moving Average, while XRP is nearing resistance. A clear breakout across these top three cryptocurrencies could help define market momentum in the opening weeks of the year.

Economic outlook 2026-2027 in advanced countries: Solidity test

After a year marked by global economic resilience and ending on a note of optimism, 2026 looks promising and could be a year of solid economic performance. In our baseline scenario, we expect most of the supportive factors at work in 2025 to continue to play a role in 2026.

Crypto market outlook for 2026

Year 2025 was volatile, as crypto often is.  Among positive catalysts were favourable regulatory changes in the U.S., rise of Digital Asset Treasuries (DAT), adoption of AI and tokenization of Real-World-Assets (RWA).