|

NZD/USD Price Analysis: Bears test key support as downside risks grow

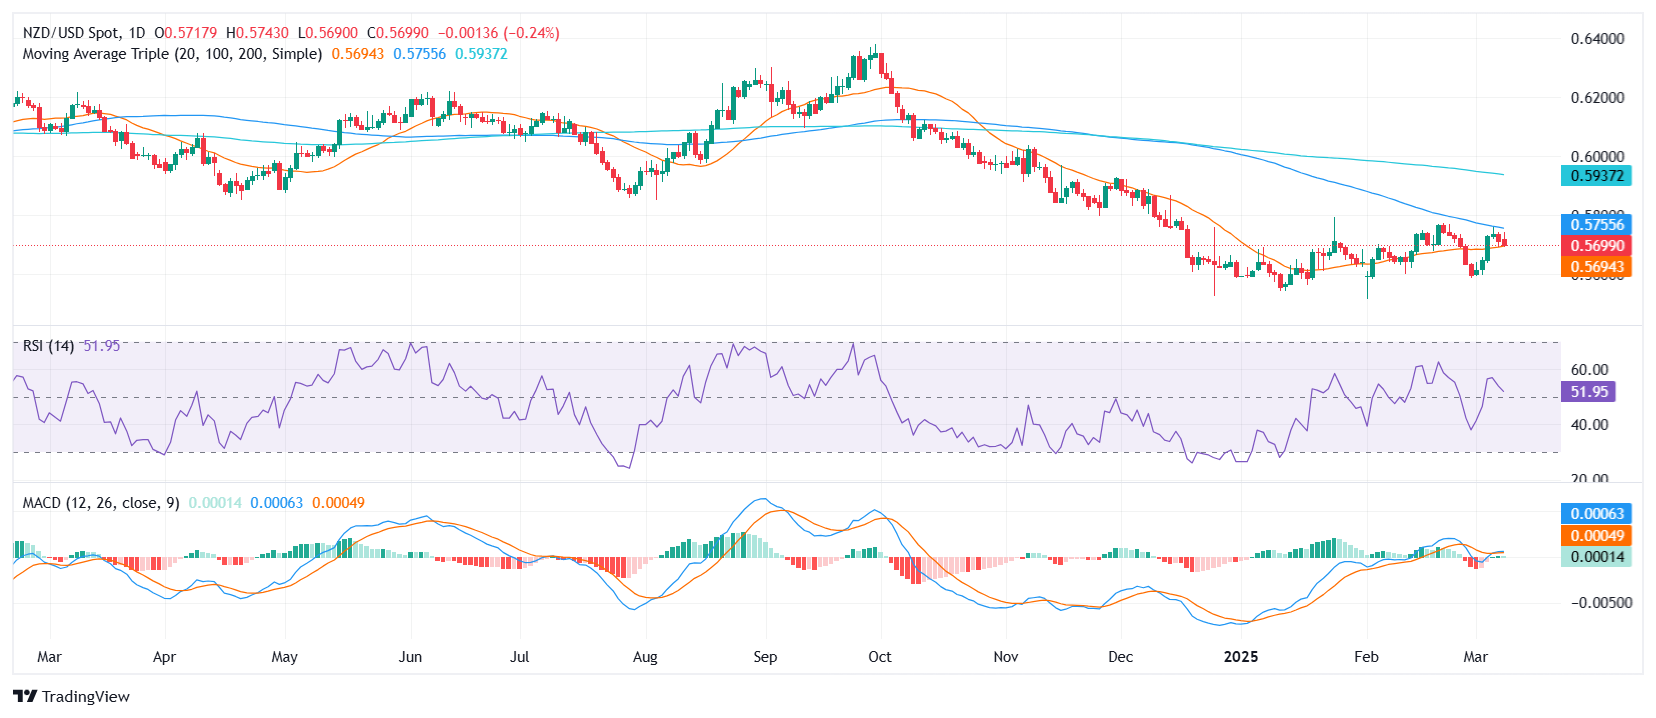
  • NZD/USD was seen trading near the 0.5700 area ahead of the Asian session, marking its second consecutive daily decline.
  • Buyers face a key test at the 20-day SMA near 0.5960, as a break below this level could accelerate selling pressure.
  • Technical indicators signal increasing downside risks, with the 100-day SMA approaching a bearish crossover with the 20-day SMA.

The NZD/USD pair extended its decline on Monday ahead of the Asian session, slipping toward the 0.5700 zone as sellers maintained control. The pair has now fallen for two straight sessions, with buyers struggling to defend the 20-day Simple Moving Average (SMA), a level that has acted as key support in recent weeks. The inability to hold above this area could trigger a deeper pullback, exposing the pair to additional losses.

Technical indicators reflect a growing bearish bias. The Relative Strength Index (RSI) remains in positive territory but is declining sharply, indicating fading bullish momentum. Meanwhile, the Moving Average Convergence Divergence (MACD) is neutral, signaling a weakening trend with limited upside potential. More importantly, the 100-day SMA is edging closer to the 20-day SMA, hinting at a potential bearish crossover that could further weigh on the pair.

Looking at key technical levels, immediate support is seen at the 20-day SMA around 0.5960. A break below this level would expose the 0.5650 region, followed by stronger support near 0.5600. On the upside, resistance stands at the 0.5750 level, with a stronger barrier at 0.5800.

NZD/USD daily chart

Author

Patricio Martín

Patricio is an economist from Argentina passionate about global finance and understanding the daily movements of the markets.

More from Patricio Martín
Share:

Markets move fast. We move first.

Orange Juice Newsletter brings you expert driven insights - not headlines. Every day on your inbox.

By subscribing you agree to our Terms and conditions.

Editor's Picks

EUR/USD bounces toward 1.1750 as US Dollar loses strength

EUR/USD returned to the 1.1750 price zone in the American session on Friday, despite falling Wall Street, which indicates risk aversion. Trading conditions remain thin following the New Year holiday and ahead of the weekend, with the focus shifting to US employment and European data scheduled for next week.

GBP/USD nears 1.3500, holds within familiar levels

After testing 1.3400 on the last day of 2025, GBP/USD managed to stage a rebound. Nevertheless, the pair finds it difficult to gather momentum and trades with modest intraday gains at around 1.3490 as market participants remain in holiday mood.

Gold trims intraday gains, approaches $4,300

Gold retreated sharply from the $4,400  area and trades flat for the day in the $4,320 price zone. Choppy trading conditions exacerbated the intraday decline, although XAU/USD bearish case is out of the picture, considering growing expectations for a dovish Fed and persistent geopolitical tensions.

Cardano gains early New Year momentum, bulls target falling wedge breakout

Cardano kicks off the New Year on a positive note and is extending gains, trading above $0.36 at the time of writing on Friday. Improving on-chain and derivatives data point to growing bullish interest, while the technical outlook keeps an upside breakout in focus.

Economic outlook 2026-2027 in advanced countries: Solidity test

After a year marked by global economic resilience and ending on a note of optimism, 2026 looks promising and could be a year of solid economic performance. In our baseline scenario, we expect most of the supportive factors at work in 2025 to continue to play a role in 2026.

Crypto market outlook for 2026

Year 2025 was volatile, as crypto often is.  Among positive catalysts were favourable regulatory changes in the U.S., rise of Digital Asset Treasuries (DAT), adoption of AI and tokenization of Real-World-Assets (RWA).